Abstract
The Cauê Aquifer is an important water supplier to the third largest urban agglomeration in Brazil. The Metropolitan Region of Belo Horizonte is in the Iron Quadrangle, site of intense iron ore mining, requiring large volumes of water and mine dewatering. In this context, we evaluate the regional impact on groundwater level between 2000 and 2019 based on a conceptual hydrogeological flow model on the eastern limb of the Moeda Syncline. This study includes the definition of boundary conditions and aquifer units, the calculation of hydrodynamic parameters, water balance, renewable reserve, and flow analysis. The Cauê, Gandarela, and Moeda aquifers are considered aquifer units, among which the Cauê Aquifer showed the highest hydraulic conductivity (9.45×10⁻⁷ m/s on average) as well as the highest recharge rate, with 38.67% rainfall. The average volume pumped was estimated at 41 million m³/year, equivalent to about 150% of the renewable reserve of the Cauê Aquifer, calculated at 27 million m³/year. Underground flow in the area tends southward, and the Cauê Aquifer acts as a water divide, which is less evident in the center of the area, where the greatest impact on groundwater level lowering occurs.
Keywords:
groundwater; hydrogeology; conceptual model; hydrogeological impact; renewable reserve
INTRODUCTION
The Iron Quadrangle is one of the main mineral provinces in Brazil, occupying approximately 7,000 km² in the central portion of the state of Minas Gerais. Its name (Quadrilátero Ferrífero, in Portuguese) comes from the mountains, supported by iron formations, arranged in the shape of a quadrangle. This province makes Minas Gerais the Brazilian state with the largest production of iron and gold in the country (approximately 311 and 55 million tons, respectively, in 2019) (ANM 2020Agência Nacional de Mineração (ANM). 2020. Anuário mineral brasileiro: principais substâncias metálicas (Ano-Base 2019). Brasília: ANM, 34 p.). In addition, deposits of manganese, bauxite, and gemstones such as topaz and emerald occur in this region (Roeser and Roeser 2010Roeser H.M.P., Roeser P.A. 2010. O Quadrilátero Ferrífero – MG, Brasil: aspectos sobre sua história, seus recursos minerais e problemas ambientais relacionados. Geonomos, 18(1):33-37. https://doi.org/10.18285/geonomos.v18i1.67
https://doi.org/https://doi.org/10.18285...
).
The Moeda Syncline, located in the western portion of the Iron Quadrangle, has 23 iron ore extraction enterprises, an activity that requires the use of large amounts of water and the lowering of the aquifer level. According to ANM (2020)Agência Nacional de Mineração (ANM). 2020. Anuário mineral brasileiro: principais substâncias metálicas (Ano-Base 2019). Brasília: ANM, 34 p., between 2000 and 2019, the production of iron ore in the state of Minas Gerais, mainly from the Iron Quadrangle, doubled, leading to a greater need for drawdown. In addition, part of the Cauê Aquifer is present in this area, which, by providing water to the main drainages in the area, is of great importance for the water supply of the third largest urban agglomeration in Brazil, the Metropolitan Region of Belo Horizonte (MRBH).
Population growth in the area, environmental disasters, and recent drought events have threatened this supply, putting pressure on groundwater reserves. The population of MRBH increased by 593,000 people (11%) between 2010 and 2020 (IBGE 2020Instituto Brasileiro de Geografia e Estatística (IBGE). 2020. Regiões Metropolitanas, Aglomerações Urbanas e Regiões Integradas de Desenvolvimento. IBGE. Available at: https://www.ibge.gov.br/geociencias/organizacao-do-territorio/estrutura-territorial/18354-regioes-metropolitanas-aglomeracoes-urbanas-e-regioes-integradas-de-desenvolvimento.html. Accessed on: May 3, 2021.
https://www.ibge.gov.br/geociencias/orga...
), while in the hydrological year 2014–2015 the southeastern region of Brazil experienced the most intense drought in 60 years, generating a high impact on water supply and hydroelectric generation (Cunha et al. 2019Cunha A.P.M.A., Zeri M., Leal K.D., Costa L., Cuartas L.A., Marengo J.A., Tomasella J., Vieira R.M., Barbosa A.A., Cunningham C., Garcia J.V.C., Broedel E., Alvalá R., Ribeiro-Neto G. 2019. Extreme drought events over Brazil from 2011 to 2019. Atmosphere, 10(11):642. https://doi.org/10.3390/atmos10110642
https://doi.org/https://doi.org/10.3390/...
). In addition, the rupture of the mining waste dam in Brumadinho in 2019 caused the suspension of the Paraopeba River abstraction for more than a year, overloading the Das Velhas River. In this scenario, hydrogeological studies are necessary to prevent supply crises, guiding the management and use of water resources.
Given this context, this study focuses on the generation of the hydrogeological conceptual flow model of the eastern limb of the Moeda Syncline, on a regional scale, contemplating monitoring data between 2000 and 2019. More specifically, it aims to delineate hydrogeological units and their flow conditions, as well as their hydrodynamic parameters, recharge and discharge volumes, and, by using these data, analyze the regional impact on groundwater levels over this 20-year period.
Once developed, the conceptual flow model of the region may contribute to a better understanding of aquifer dynamics, water availability, and, consequently, its sustainable use.
CHARACTERIZATION OF THE STUDY AREA
Location
The study area is in the central portion of the state of Minas Gerais, in the eastern limb of the so-called Moeda Syncline. It extends between the municipalities of Belo Horizonte, to the north, and Ouro Preto, to the south, also including part of the municipalities of Itabirito, Rio Acima, and Nova Lima, as shown in Figure 1.

The study area encompasses approximately 305 km² and is bounded to the west and south by the axes of the Moeda and Dom Bosco synclines, respectively, and to the east by a zone of 1 km beyond the occurrence of Minas Supergroup rocks.
Within this area, there are 13 mines, distributed from the north to its central portion. This is not a densely urbanized area, except for some residential condominiums located north of the area.
Climate
According to the Köppen-Geiger climate classification (Köppen and Geiger 1928Köppen W., Geiger R. 1928. Klimate der Erde. Gotha: Verlagcondicionadas, Justus Perthes.) updated by Álvares et al. (2014)Álvares C.A., Stape J.L., Sentelhas P.C., Gonçalves J.L. de M., Sparovek G. 2014. Köppen’s climate classification map for Brazil. Meteorologische Zeitschrift, 22(6):711-728. https://doi.org/10.1127/0941-2948/2013/0507
https://doi.org/https://doi.org/10.1127/...
, the climate of the study area is considered humid subtropical with a dry winter and temperate summer (Cwb type). Two seasons can be well defined in this type of climate: the first, from October to March, is humid and hot; and the second, from April to September, is cold and dry. According to data from the Belo Horizonte weather station (83587), the closest to the area for which temperature data are available, the average monthly temperature varies between 18.8 and 23.5°C in July and February, respectively. The average annual accumulated precipitation is 1,552 mm (INMET 2020Instituto Nacional de Meteorologia (INMET). 2020. Banco de dados meteorológico para ensino e pesquisa - BDMEP. Brasília. Available at: https://bdmep.inmet.gov.br/. Accessed on Feb. 10, 2013.
https://bdmep.inmet.gov.br/...
), with about 88% of the precipitation occurring in the rainy season.
Hydrography
The study area is in the Das Velhas River State Basin, the largest affluent of the São Francisco River Federal Basin. More specifically, the area encompasses affluents of the left margin of the so-called Upper Das Velhas River Watershed (Fig. 2), which concentrates 70.9% of the estimated basin population (CBH Rio das Velhas 2015CBH Rio das Velhas. 2015. Plano Diretor de Recursos Hídricos da Bacia Hidrográfica do Rio das Velhas: resumo executivo. Belo Horizonte. Available at: https://cdn.agenciapeixevivo.org.br/media/2020/06/RESUMO-EXECUTIVO-PDRH-VELHAS-2015.pdf. Accessed on: Sept. 16, 2021.
https://cdn.agenciapeixevivo.org.br/medi...
). The main affluents present are the Itabirito River, Do Peixe River, Dos Macacos Stream, Água Suja Stream, and Arrudas Stream.

The Das Velhas River is of paramount importance for the supply of the MRBH. It alone is responsible for providing water to more than 60% of the population of Belo Horizonte and 40% of the 6 million inhabitants of the MRBH (CBH Rio das Velhas 2019CBH Rio das Velhas. 2019. Comitê da Bacia Hidrográfica do Rio das Velhas. Revista Rio das Velhas, (9).). Due to the high demand, in late 2018, a request was made to declare areas of conflict for the use of water resources in the Upper Das Velhas River region. The situation has recently been aggravated by the rupture of the Córrego do Feijão dam, which occurred in Brumadinho in 2019, compromising part of the supply coming from the Paraopeba River Basin. This basin is responsible for approximately 60% of the MRBH supply, so the incident further overloaded the Das Velhas River supply system.
Geology
The Iron Quadrangle is in the southeastern portion of the São Francisco Craton, which constitutes a tectonic unit formed by Archean and Paleoproterozoic lithologies. This area is structured in the form of domes and keels, typical of Greenstone Belts. The domes are represented by the rocks of the metamorphic complexes, while the keels are formed by the Das Velhas River Supergroup and Minas Supergroup, structured in the form of folds (Alkmim and Marshak 1998Alkmim F.F., Marshak S. 1998. Transamazonian Orogeny in the Southern São Francisco Craton Region, Minas Gerais, Brazil: evidence for Paleoproterozoic collision and collapse in the Quadrilátero Ferrífero. Precambrian Research, 90(1-2):29-58. https://doi.org/10.1016/S0301-9268(98)00032-1
https://doi.org/https://doi.org/10.1016/...
).
The Moeda Syncline forms a keel between the domes of Bonfim to the west and Bação to the east. The fold has an asymmetric structure, with the western limb being inverted and the eastern limb approximately verticalized. Both limbs are cut by east-west oriented faults and fractures, one of them being the Codornas fault (Fig. 3). This structure, defined by Braga (2006)Braga S.C.M. 2006. Modelagem estrutural e geofísica da porção centro-norte do Sinclinal Moeda, Quadrilátero Ferrífero, MG. MS Dissertation, Universidade Federal de Ouro Preto, Ouro Preto, 113 p., separates the northern and southern structural compartments in the Moeda Syncline. The southern compartment is more deformed, with greater shortening, resulting in a lower apparent thickness of the layers at the base of the Minas Supergroup.

The junction of the Moeda Syncline with the Serra do Curral Homocline shows an interference pattern and a series of westward shear faults (Alkmim and Marshak 1998Alkmim F.F., Marshak S. 1998. Transamazonian Orogeny in the Southern São Francisco Craton Region, Minas Gerais, Brazil: evidence for Paleoproterozoic collision and collapse in the Quadrilátero Ferrífero. Precambrian Research, 90(1-2):29-58. https://doi.org/10.1016/S0301-9268(98)00032-1
https://doi.org/https://doi.org/10.1016/...
). One example is the north-south oriented Mutuca Fault (Fig. 3), which delimits the so-called Tamanduá-Mutuca Belt.
The eastern limb of the Syncline presents a higher deformational intensity than the western limb. Transcurrent faults occur in this region, such as the Bonga Fault and the Cata Branca Fault (Fig. 3) and basic dikes in the same direction.
As for the stratigraphic units, rocks of the Archean Metamorphic Complex, Das Velhas River Supergroup, Minas Supergroup, Itacolomi Group, lateritic coverings (canga), and recent alluvial and colluvial coverings occur in the Moeda Syncline. The most relevant units are described in Table 1 and presented on a map in Figure 3.
Among the units presented is the Minas Supergroup, which occupies most of the study area and can reach up to 6,000 m thick (Roeser and Roeser 2010Roeser H.M.P., Roeser P.A. 2010. O Quadrilátero Ferrífero – MG, Brasil: aspectos sobre sua história, seus recursos minerais e problemas ambientais relacionados. Geonomos, 18(1):33-37. https://doi.org/10.18285/geonomos.v18i1.67
https://doi.org/https://doi.org/10.18285...
). It is a Paleoproterozoic metasedimentary sequence that overlies the Das Velhas River Supergroup discordantly (Silva et al. 2005Silva S.L., Monteiro E.A., Baltazar O.F. 2005. Geologia. In: CPRM/SEMAD/CEMIG. Projeto APA Sul RMBH - estudos do meio físico: área de proteção ambiental da região metropolitana de Belo Horizonte. Belo Horizonte: CPRM/SEMAD, 73 p.). In this unit are the most resistant rocks that sustain the mountain ranges, generating the quadrangle shape. One of them is the Cauê Formation, the focus of this study, which stands out due to its iron and gold deposits, being the most important stratigraphic unit of the Iron Quadrangle from an economic point of view.
Hydrogeology
Several classifications of the aquifer units in the Moeda Syncline have already been made. Among them, the ones by Beato et al. (2005)Beato D.A.C., Monsores A.L.M., Bertachinni A.C. 2005. Hidrogeologia. In: CPRM/SEMAD/CEMIG. Projeto Apa Sul RMBH - estudos do meio físico: área de proteção ambiental da região metropolitana de Belo Horizonte. Belo Horizonte: CPRM/SEMAD, 116 p. and Mourão (2007)Mourão M.A.A. 2007. Caracterização hidrogeológica do Aquífero Cauê: subsídios para a gestão de recursos hídricos no Quadrilátero Ferrífero. Thesis, Universidade Federal de Minas Gerais, Belo Horizonte, 297 p. stand out. Beato et al. (2005)Beato D.A.C., Monsores A.L.M., Bertachinni A.C. 2005. Hidrogeologia. In: CPRM/SEMAD/CEMIG. Projeto Apa Sul RMBH - estudos do meio físico: área de proteção ambiental da região metropolitana de Belo Horizonte. Belo Horizonte: CPRM/SEMAD, 116 p. considered the existence, in the study region, of the following aquifer systems: Granular, Quartzitic, Quartzite Cercadinho, Itabirite, Carbonatic, Schistose, Iron Formation, and Granite-Gneissic. In contrast, argillites, phyllites, graphitic schist, gabbro, and diabase are considered aquitards. Mourão (2007)Mourão M.A.A. 2007. Caracterização hidrogeológica do Aquífero Cauê: subsídios para a gestão de recursos hídricos no Quadrilátero Ferrífero. Thesis, Universidade Federal de Minas Gerais, Belo Horizonte, 297 p., similarly, classified the units into unconsolidated aquifers, quartzitic aquifers, carbonate aquifers, aquifers in ferriferous formations, in schists, in granite-gneissic rocks, and confining units.
Among the aquifer units mentioned, the most productive unit in the area is the aquifer in ferriferous formations, called the Cauê Aquifer. This presents fissural and granular porosity, with a predominance of one or the other locally. The lithological variety, structural complexity, and different intensities of weathering in the aquifer contribute to the variation of storage and hydraulic conductivity, with the friable ore bodies being more productive. The Batatal Formation, of low permeability, limits the base of the overlying units in the Moeda Syncline, favoring groundwater accumulation in the Syncline’s internal lithologies, mainly in the Cauê and Gandarela units (Mourão 2007Mourão M.A.A. 2007. Caracterização hidrogeológica do Aquífero Cauê: subsídios para a gestão de recursos hídricos no Quadrilátero Ferrífero. Thesis, Universidade Federal de Minas Gerais, Belo Horizonte, 297 p.).
It is noteworthy that despite presenting, in general, high productivity, the Cauê Aquifer shows significant differences in its composition, structuring, and flow dynamics, which results in variable hydraulic characteristics. Thus, Mourão (2007)Mourão M.A.A. 2007. Caracterização hidrogeológica do Aquífero Cauê: subsídios para a gestão de recursos hídricos no Quadrilátero Ferrífero. Thesis, Universidade Federal de Minas Gerais, Belo Horizonte, 297 p. proposed the subdivision of this unit into semi-friable, compact laminated and compact massive hematites, fresh, lateritic, and friable itabirites. The semi-friable hematites and the laminated compact hematites present the highest values of total porosity. In addition, a marked difference in permeability is observed in the directions parallel and perpendicular to the lamination, with the one along the bedding being approximately three times higher than the orthogonal direction.
Dantas et al. (2017)Dantas J.C.M., Mesquita D.C., Paula R.S., Guerra K.J. 2017. Correlação entre dados de perfilagem geofísica e potencial de bombeamento de poços em litotipos da Formação Cauê no sudoeste do Quadrilátero Ferrífero, MG. Águas Subterrâneas, 31(4):373-383. https://doi.org/10.14295/ras.v31i4.28910
https://doi.org/https://doi.org/10.14295...
subdivided the Cauê Aquifer into hematite, itabirite, clayey itabirite, and carbonatic itabirite, with each of the lithologies separated into soft and compact. In this study, the soft hematites were more favorable for the presence of water, followed by the soft itabirites. Compact lithologies are less propitious for the presence of water due to the resistance to erosion and fracturing, and clay lithotypes showed lower specific flow rates, while carbonate itabirites were not favorable for the presence of water.
Finally, Paula et al. (2018)Paula R.S., Mesquita D.C., Dantas J.C.M., Guerra K.J. 2018. Caracterização hidroquímica e isotópica das águas, na porção sudoeste do Quadrilátero Ferrífero no município de Congonhas-MG, e sua correlação com a localização em cota das unidades aquíferas deste sistema. Águas Subterrâneas, 32(1):140-153. https://doi.org/10.14295/ras.v32i1.28970
https://doi.org/https://doi.org/10.14295...
subdivided the Cauê Aquifer in the southwestern region of the Moeda Syncline into strata with waters of different ages, evidencing the speed of water renewal at different depths. Young waters were considered as those above the 1,000 m elevation; intermediate waters between 850 and 1,000 m and old waters below 850 m.
To characterize the aquifer units, hydrodynamic parameters such as hydraulic conductivity (K), transmissivity (T), and storage (S) are compared. Among the parameters calculated for the Cauê Aquifer in previous works (Table 2), we highlight the works of Mourão (2007)Mourão M.A.A. 2007. Caracterização hidrogeológica do Aquífero Cauê: subsídios para a gestão de recursos hídricos no Quadrilátero Ferrífero. Thesis, Universidade Federal de Minas Gerais, Belo Horizonte, 297 p., carried out in the central-northern portion of the Moeda Syncline; Mesquita et al. (2017)Mesquita D.C., Dantas J.C.M., Paula R.S., Guerra K.J. 2017. Estudo dos parâmetros hidrodinâmicos obtidos em ensaios de campo em itabiritos brandos da porção sudoeste do Quadrilátero Ferrífero, MG. Geonomos, 25(2):12-19. https://doi.org/10.18285/geonomos.v25i2.1077
https://doi.org/https://doi.org/10.18285...
, who presented parameters referring to the southwestern region of this structure; Guerra (2010)Guerra K.J. 2010. Aplicação de método geofísico em estudo hidrogeológico no município de Nova Lima – MG: caracterização de aquíferos em área urbana. MS Dissertation, Instituto de Geociências, Universidade Federal de Minas Gerais, Belo Horizonte, 116 p., who performed tests in the municipality of Nova Lima, in the Serra do Curral Homocline; and Schlumberger Water Services (2017)Schlumberger Water Services. 2017. Estudo Hidrogeológico Coca-Cola FEMSA Unidade Itabirito. Rio de Janeiro: Schlumberger Water Services. and Bertachini (2020)Bertachini M.N.A. 2020. Determinação da condutividade hidráulica do Aquífero Cauê na região oeste do Sinclinal Moeda, Nova Lima/MG. Monografia, Universidade de São Paulo, São Paulo. in the western edge of the Syncline.
According to Mourão (2007)Mourão M.A.A. 2007. Caracterização hidrogeológica do Aquífero Cauê: subsídios para a gestão de recursos hídricos no Quadrilátero Ferrífero. Thesis, Universidade Federal de Minas Gerais, Belo Horizonte, 297 p. and Mesquita et al. (2017)Mesquita D.C., Dantas J.C.M., Paula R.S., Guerra K.J. 2017. Estudo dos parâmetros hidrodinâmicos obtidos em ensaios de campo em itabiritos brandos da porção sudoeste do Quadrilátero Ferrífero, MG. Geonomos, 25(2):12-19. https://doi.org/10.18285/geonomos.v25i2.1077
https://doi.org/https://doi.org/10.18285...
, the hydraulic conductivity in the soft itabirite shows continuity across the entire Moeda Syncline, which is corroborated by Guerra (2010)Guerra K.J. 2010. Aplicação de método geofísico em estudo hidrogeológico no município de Nova Lima – MG: caracterização de aquíferos em área urbana. MS Dissertation, Instituto de Geociências, Universidade Federal de Minas Gerais, Belo Horizonte, 116 p. and Bertachini (2020)Bertachini M.N.A. 2020. Determinação da condutividade hidráulica do Aquífero Cauê na região oeste do Sinclinal Moeda, Nova Lima/MG. Monografia, Universidade de São Paulo, São Paulo.. The variation in transmissivity values presented indicates the variation in thickness of the Cauê Formation, in addition to the presence of regions of confinement and structural control associated with secondary permeability. The large variation of storage values (Sy) for the Cauê Aquifer reinforces the heterogeneity of this unit in the Moeda Syncline, reflecting its structural complexity and localized confinements.
As for the other studied units, few hydrodynamic parameters have been defined in the literature. Ferreira and Bacellar (2010)Ferreira Q.C.G., Bacellar L.A.P. 2010. Avaliação preliminar das condições hidrogeológicas na área do município de Ouro Preto, MG. Geonomos, 18(1):13-21. https://doi.org/10.18285/geonomos.v18i1.63
https://doi.org/https://doi.org/10.18285...
indicated transmissivity values between 9×10⁻⁶ and 1.4×10⁻⁴ m²/s for the Bação Complex, and between 1.1×10⁻⁶ and 5.8 m²/s for the Piracicaba Group, both in the municipality of Ouro Preto. Mourão (2007)Mourão M.A.A. 2007. Caracterização hidrogeológica do Aquífero Cauê: subsídios para a gestão de recursos hídricos no Quadrilátero Ferrífero. Thesis, Universidade Federal de Minas Gerais, Belo Horizonte, 297 p., however, determined the hydraulic conductivity based on laboratory tests, reaching a result of 3.5×10⁻⁹ m/s for the quartzite of the Moeda Formation and 9.2×10⁻⁸ m/s for the semi-composite phyllite of the Batatal Formation.
The recharge is also an important parameter to analyze the hydrogeological dynamics of the area. According to Mourão (2007)Mourão M.A.A. 2007. Caracterização hidrogeológica do Aquífero Cauê: subsídios para a gestão de recursos hídricos no Quadrilátero Ferrífero. Thesis, Universidade Federal de Minas Gerais, Belo Horizonte, 297 p., the recharge values in the region are mainly related to the soil types and geology, and the highest rates are in the Cauê Formation (above 38%). Also, according to the author, the recent covers, rocks of the Bação Complex, and the Moeda Formation show recharge rates below 28% of annual precipitation. Rocks of the Das Velhas River Supergroup, Batatal Formation, and part of the Piracicaba Group present recharge rates of between 28 and 38%. Bertachini et al. (2012)Bertachini M.N.A., Bertachini A.C., Pereira B., Grandchamp C.A., Nunes F., Pereira Filho M. 2012. Estudos sobre os efeitos da Recarga Artificial (RA) sobre o Aquífero Cauê, no Quadrilátero Ferrífero-MG. In: Congresso Brasileiro de Águas Subterrâneas, 17., Bonito. Proceedings… Bonito. pointed out that the recharge rate in the Cauê Aquifer is around 35–40% of total precipitation, while regions with mining pit formation can reach recharges of up to 84%.
Freitas and Bacellar (2013)Freitas S.M.A.C., Bacellar L.A.P.B. 2013. Avaliação da Recarga de Aquíferos em Microbacias do Alto Rio das Velhas, Minas Gerais. Revista Brasileira de Recursos Hídricos, 18(2):31-39. https://doi.org/10.21168/rbrh.v18n2.p31-38
https://doi.org/https://doi.org/10.21168...
presented the different behaviors regarding recharge between the Bação Metamorphic Complex, composed of gneiss, and the Nova Lima Group, composed of schists. While the rocks of the Nova Lima Group allow for higher values of annual recharge (about 28%), those of the Bação Complex show a recharge of approximately 18% and conserve groundwater in the system for a longer period.
MATERIALS AND METHODS
The methods used include data collection, definition of boundary conditions, definition of aquifer units, definition of hydrodynamic parameters, water balance and calculation of the renewable reserve, and flow analysis.
Data collection
The data collection stage consisted of extracting them from the Water Management Institute of Minas Gerais (Igam) database, the Hidroweb portal, the National Water Agency (ANA), the National Meteorology Institute (INMET), and the Economic Development Company of Minas Gerais (CODEMIG). In Igam’s database, public reports of compliance with conditions and requests for grants from large enterprises in the area were analyzed, as well as grants for isolated wells.
At the end of the data collection, 13 mines were identified as being totally or partially located in the study area. Among these, 10 had been granted a concession for groundwater extraction at some point in the last 20 years. In addition, 34 grants were located within the study area for tube wells for human and industrial consumption, which do not require periodic reports, and therefore provide less information.
In all, data were collected from 73 springs, 189 water level measuring instruments (piezometers and groundwater level indicators), 26 fluviometric stations within the area, and 7 rainfall stations in the region. The historical series surveyed comprised at least part of the period of interest, i.e., between 2000 and 2019.
Boundary conditions
In hydrogeological modeling, boundary conditions are used to define, based on the actual hydrogeological system, the hydraulic or physical boundaries that delimit the model domain, as well as its inputs and outputs. The following will describe the conditions that can occur at model boundaries.
Physical barriers can be exemplified as surface water bodies that act at a base level for the aquifer, or by the presence of impermeable rock. Hydraulic barriers, however, control the flow of groundwater, such as water divides or flow lines.
The boundary conditions for a hydrogeological system are classified as follows, according to Anderson and Woessner (1992)Anderson M.P., Woessner W.W. 1992. Applied groundwater modeling: simulation of flow and advective transport. San Diego: Academic Press, 381 p.:
-
Type 1: specified hydraulic head (Dirichlet condition): the hydraulic head along this boundary condition is defined;
-
Type 2: specified flow (Neumann condition): the flow along this boundary condition is defined. It includes the no-flux condition, which is defined by specifying the flow as zero;
-
Type 3: hydraulic head-dependent flow (mixed Robin or Cauchy conditions): in this type of boundary condition, the flow is calculated from a given hydraulic head.
In this study, only no-flux conditions will be detailed, aiming to define the physical limits of the model. Geological or hydraulic structures that hinder the flow were classified as no-flux, as they have lower permeability than others.
Definition of aquifer units
Aquifer units are lithostratigraphic units or parts of them that present approximately uniform characteristics. The characteristics considered for the definition of aquifer units are mainly the lithology, rock structures, hydrodynamic parameters, and productivity. A good definition of these units is of paramount importance for the construction of a model that is more consistent with reality and with the scale of analysis defined.
For this study, the modified geological base map of the Iron Quadrangle Geology Project, scale 1:50,000 (Lobato et al. 2005Lobato L.M., Baltazar O.F., Reis L.B., Achtschin A.B., Baars F.J., Timbó M.A., Berni G.V., Mendonça B.R.V., Ferreira D.V. 2005. Projeto Geologia do Quadrilátero Ferrífero – Integração e Correção Cartográfica em SIG. Folha Ouro Preto. Escala 1:50.000.Belo Horizonte: Companhia de Desenvolvimento Econômico de Minas Gerais.), was used to contemplate the geological units of interest. The hydrodynamic parameters, descriptions of each lithology, and the location of groundwater abstraction grants were also searched in the bibliography.
To distinguish between Aquiferous and Non-Aquiferous Units, the model of the United States Groundwater Atlas (Miller 1999Miller J.A. 1999. Groundwater Atlas of the United States: introduction and national summary. United States Geological Survey Publication HA 730-A, 15 p.) was adopted, in which geological units that produce significant amounts of water through wells or springs were considered aquifers. Thus, previous classifications of the units and their respective parameters were consulted in the bibliography. Less productive units of less importance were grouped into undivided units.
Finally, the spatial arrangement of the layers was obtained using the geological base map cited and information from previous bibliographies on the structural geology of the Iron Quadrangle (Chemale Jr. et al. 1994Chemale Jr. F., Rosière C.A., Endo I. 1994. The tectonic evolution of the Quadrilátero Ferrífero, Minas Gerais, Brazil. Precambrian Research, 65(1-4):25-54. https://doi.org/10.1016/0301-9268(94)90098-1
https://doi.org/https://doi.org/10.1016/...
, Alkmim and Marshak 1998Alkmim F.F., Marshak S. 1998. Transamazonian Orogeny in the Southern São Francisco Craton Region, Minas Gerais, Brazil: evidence for Paleoproterozoic collision and collapse in the Quadrilátero Ferrífero. Precambrian Research, 90(1-2):29-58. https://doi.org/10.1016/S0301-9268(98)00032-1
https://doi.org/https://doi.org/10.1016/...
, Mourão 2007Mourão M.A.A. 2007. Caracterização hidrogeológica do Aquífero Cauê: subsídios para a gestão de recursos hídricos no Quadrilátero Ferrífero. Thesis, Universidade Federal de Minas Gerais, Belo Horizonte, 297 p.). To represent the lithological structure of the area, geological profiles parallel to the dip directions of the layers were made to obtain their average, maximum, and minimum thicknesses in true dimension.
Finally, an estimate of the water level depth was made from the analysis of the difference between the topographic and potentiometric surfaces, obtained by geoprocessing tools.
Hydrodynamic parameters
To obtain the hydraulic conductivity (K), storage (S), and transmissivity (T), the results of 15 pumping tests obtained from the Igam database were used, which were performed in different units of the study area. Due to the low availability of tests and consequent low representativeness of the units, the data obtained this way were used only for comparison with the results of other authors.
For the analysis of the data obtained, the characteristics of each well as the series of water level data in the test recovery phase were entered into the AquiferTest 2016.1 software (Waterloo Hydrogeologic 2016Waterloo Hydrogeologic. 2016. AquiferTest Pro v.2016.1: Pumping & Slug Test Analisys, Interpretation & Visualization Software. Waterloo: Waterloo Hydrogeologic.). Due to the heterogeneity of the analyzed system, unavailability of the lithological profiles of the wells, and little information about the tested unit, it was chosen to interpret the information by the methods of Bouwer-Rice (Bouwer and Rice 1976Bouwer H., Rice R.C. 1976. A Slug test method for determining hydraulic conductivity of unconfined aquifers with completely or partially penetrating wells. Water Resources Research, 12(3):423-428. https://doi.org/10.1029/WR012i003p00423
https://doi.org/https://doi.org/10.1029/...
) and Cooper-Bredehoeft-Papadoulos (Cooper Jr. et al. 1967Cooper Jr. H.H., Bredehoeft J.D., Papadopulos S.S. 1967. Response of a finite-diameter well to an instantaneous charge of water. Water Resources Research, 3(1):263-269. https://doi.org/10.1029/WR003i001p00263
https://doi.org/https://doi.org/10.1029/...
).
The Bouwer-Rice (1976)Bouwer H., Rice R.C. 1976. A Slug test method for determining hydraulic conductivity of unconfined aquifers with completely or partially penetrating wells. Water Resources Research, 12(3):423-428. https://doi.org/10.1029/WR012i003p00423
https://doi.org/https://doi.org/10.1029/...
method is used for calculating the hydraulic conductivity from the well’s construction characteristics, effective test radius, lowering at time zero, and the time it takes for the water level to return to the initial level. This method assumes the existence of an aquifer with infinite lateral extensions, homogeneous, and of uniform thickness, with an initially horizontal potentiometric surface and an instantaneous volume injected or withdrawn from the well. Overall, it can be said that these assumptions are reasonable since the radius of influence of the tests is insignificant if compared to the extent of the aquifers.
Finally, the Cooper-Bredehoeft-Papadoulos method (1967)Cooper Jr. H.H., Bredehoeft J.D., Papadopulos S.S. 1967. Response of a finite-diameter well to an instantaneous charge of water. Water Resources Research, 3(1):263-269. https://doi.org/10.1029/WR003i001p00263
https://doi.org/https://doi.org/10.1029/...
provides the transmissivity (T) and storage coefficient (S) from type curves. In addition to the assumptions cited above, this test also assumes that the aquifer is confined, undrained, and isotropic, with only horizontal flow, and the pumping well is considered fully penetrating.
Water balance and renewable reserve calculation
In regional hydrogeological models, the water balance is of paramount importance to estimate the volume of water that infiltrates into the aquifer. From these data, it is possible to measure the impact caused by groundwater pumping.
To calculate the water balance, a rainfall analysis was initially performed using a data series accessed through the Hidroweb portal. Stations distributed throughout the study area that had complete data series between 2000 and 2019 were selected. Then, the most representative stations were selected based on the average rainfall for the area. Thus, it was possible to use the location of the stations to separate the area into polygons according to the Thiessen Method (Thiessen 1911Thiessen A.H. 1911. Precipitation averages for large areas. Monthly Weather Review, 39(7):1082-1084. https://doi.org/10.1175/1520-0493(1911)39%3C1082b:PAFLA%3E2.0.CO;2
https://doi.org/https://doi.org/10.1175/...
).
Subsequently, water surplus (WS), water deficit (WD), actual evapotranspiration (ETA), and potential evapotranspiration (PET) were calculated by the climatological water balance method of Thornthwaite and Mather (1955)Thornthwaite C.W., Mather J.R. 1955. The water balance. New Jersey: Drexel Institute of Technology, 104 p. Publications in Climatology., using the calculation sheets developed by Rolim et al. (1998)Rolim G.S., Sentelhas P.C., Barbieri V. 1998. Planilhas no ambiente EXCEL para os cálculos de balanços hídricos: normal, seqüencial, de cultura e de produtividade real e potencial. Revista Brasileira de Agrometeorologia, 6(1):133-137.. The calculation was performed for the most representative station of the area according to the Thiessen analysis, from the monthly precipitation averages for the years 2000–2019. The value of 100 mm was considered for the soil available water capacity (AWC or water holding capacity), which is the moisture content that remains in soil after a long period of gravitational drainage without water supply at the land surface (Feitosa et al. 2008Feitosa F.A.C., Manoel Filho J., Feitosa E.C., Demetrio J.G.A. 2008. Hidrogeologia: conceitos e aplicações. Rio de Janeiro: CPRM; Recife: LABHID, 812 p.).
The recharge rate in each hydrogeological unit was then calculated by the method of separation of hydrograms by Barnes (1939)Barnes B.S. 1939. The structure of discharge recession curves. Transactions - American Geophysical Union, 20(4):721-725. https://doi.org/10.1029/TR020i004p00721
https://doi.org/https://doi.org/10.1029/...
, which consists of graphically separating base flow from surface runoff. For this calculation, the most representative year of the studied period was evaluated, that is, the one whose rainfall was closest to the average annual rainfall between 2000 and 2019.
To initially estimate the recharge rate, the fluviometric stations present in the area and its vicinity whose basins encompass mostly one of the hydrogeological units of interest were selected. The total rainfall for each month of the reference year was multiplied by the area of each basin to obtain the total monthly precipitation volume.
Subsequently, the monthly average flow series for the defined year was plotted for the separation of hydrograms. Relating the base flow with the precipitated volume, the recharge rate in each of the basins was obtained, and consequently in each hydrogeological unit as well.
With the separation of base flow, it was also possible to obtain the Base Flow Index (BFI), which, according to Gustard et al. (1992)Gustard A., Bullock A., Dixon J.M. 1992. Low flow estimation in the United Kingdom. Wallingford: Institute of Hydrology, 88 p., consists of the proportion of groundwater in the total flow of a river and is used to identify the effect of geology on its flow rate.
Subsequently, using the values defined for the recharge rate, the renewable reserve of the Cauê Aquifer and the entire study area was estimated. The renewable reserve consists of the water volume accumulated in the aquifer medium as a function of the effective porosity. It is variable annually due to seasonal contributions of surface water, underground runoff, and outlets (Costa 1998Costa W.D. 1998. Avaliação de reservas, potencialidade e disponibilidade de aquífero. In: Congresso Brasileiro de Água Subterrânea, 10., São Paulo. Proceedings... São Paulo.).
Initially, the renewable reserve of the Cauê Aquifer alone was calculated for each hydrological year in the domain area of each rainfall station. By summing the values obtained for the domains of each station, the renewable reserve of the Cauê Aquifer in the study area was obtained for each hydrological year of interest, between 2000 and 2019. Subsequently, the same procedure was performed with the other units, which allowed obtaining the renewable reserve of the entire area for each year of the analyzed period.
To make a comparison of the renewable reserves calculated with the total pumping of the area in each year, the pumping rates for each enterprise located in the area were searched in the Igam database. These data were compiled and added up annually.
Flow analysis
For the flow analysis of the studied area, a potentiometric map of the region was made with water level data from the year 2019, and the lowering of the water level over the period was analyzed in graphs. These data were obtained from mining company reports, which are available in the Igam database, and are thus concentrated near the mining pits.
For the selection of the monitoring instruments used for the construction of the potentiometric map, the criteria of location and available data for each instrument were used, so that the whole area was represented as to the underground water level. The regions with data deficiency were filled in by control points, defined as points in perennial drainages, connected to the aquifer. From the curves, a potentiometric surface was also generated, using the software Leapfrog Geo (Seequent), for better visualization of the cones of depression. Based on the manually constructed curves and the generated surface, the main existing flow directions were interpreted.
The drawdown was analyzed using graphs, separated by sectors, containing the variation of the water level over time at the monitored points that contained a significant period of data.
With these analyses, it was possible to identify the most pronounced cones of depression, the variation of the hydraulic head over the analyzed time, the base level of the region, and compare the flow velocity between the units.
Results
Boundary conditions
As described in the Methods section, the no-flux boundary conditions were defined according to the regional knowledge of the study area, based on the lithologies considered to be less permeable than the others.
Thus, as it is a rock with little porosity and low pore connection, it can be said that the schist of the Nova Lima Group, which outcrops at the eastern edge of the area, is generally considered impermeable. For this reason, the contact between the Moeda Formation and the Nova Lima Group, indicated with number 3 in Figure 4, is considered a Neumann condition of no flow. The same occurs with the Piracicaba Group, composed of phyllite and quartzite, which outcrops in the center of the syncline, whose contact with the Gandarela Formation is indicated by number 4 in Figure 4.

To the north of the area, the Itabira and Caraça groups present continuity to the Serra do Curral Homocline. Therefore, as Cauchy boundary conditions (head-dependent flow) were used, the Moeda Syncline Axis, which divides the Gandarela Formation, and the NW/SE Fault that segments the four formations at the intersection between the Moeda Syncline and Serra do Curral Homocline are represented in Figure 4.
Definition of aquifer units
The hydrogeological units identified are consistent with the geological units. Based on their lithological characteristics and previous bibliographies, these units were separated into aquiferous and non-aquiferous, as shown in Table 3.
Description and geometry of the identified hydrogeological units on the eastern limb of the Moeda Syncline.
The aquiferous lithologies have high permeability and are considered potential aquifers by Bertachini (1994)Bertachini A.C. 1994. Hidrogeologia e desaguamento da mina de Águas Claras. In: Congresso Brasileiro de Águas Subterrâneas – ABAS, 8., Recife. Proceedings… Recife, p. 274-283. and Beato et al. (2006)Beato D.A.C., Monsores A.L.M., Bertachini A.C. 2006. Potencial aquífero nos metassedimentos do Quadrilátero Ferrífero - região da APA SUL RMBH - MG. In: Congresso Brasileiro de Águas Subterrâneas, 14., Curitiba. Proceedings… Curitiba, p. 1-20.. The other lithologies present lower storage capacity and/or permeability and will thus be considered non-productive units. They are made up predominantly of lithologies that in general present low productivity and lower hydrogeological potential than the others.
It is worth mentioning that the non-aquiferous lithologies can behave locally as aquifers, depending mainly on their level of fracturing. However, in general, these units exchange water at a low velocity, which will be disregarded since this is a regional scale study. Thus, the units considered as boundary conditions were called aquitards, as listed in Table 3.
Although the alluvial covers were considered aquifers, their low thickness in comparison with the others makes them irrelevant in this regional study, being considered only as storage units and recharge facilitators for the underlying units.
Despite not being the only aquifer unit, it is worth noting the importance of the Cauê Aquifer as the most productive in the region, which could be ascertained by the number of pumping wells allocated to this unit. In all, 185 licensed wells were identified in the study area, including supply wells and water-level lowering wells. Among these, 136 are in the Cauê Formation, and the others are divided among the units Nova Lima (10), Moeda (8), Batatal (17), and Gandarela (14). Furthermore, among the units considered as aquifers, the Cauê Aquifer is the one that occupies the largest area in the studied region, as listed in Table 3.
Regarding the depth of the water level observed in Table 3, a well-defined pattern is noted: the greatest depth in relation to the surface is recorded in the Cauê Aquifer, with a progressive reduction in adjacent units, with the shallowest level being in the Piracicaba Aquitard. This occurs as a result not only of the higher outcropping levels of the Cauê Formation but also due to pumping, which occurs mostly in this aquifer unit.
From the profiles made, it was possible to obtain the thicknesses of each hydrogeological unit. As observed on the geological map and in the work by Braga (2006)Braga S.C.M. 2006. Modelagem estrutural e geofísica da porção centro-norte do Sinclinal Moeda, Quadrilátero Ferrífero, MG. MS Dissertation, Universidade Federal de Ouro Preto, Ouro Preto, 113 p., the Gandarela, Cauê, Batatal, and Moeda units present greater thickness in the northern portion of the area, with thinning in the southern portion. The same was observed in the profile, as can be seen in Figure 5.

Lithological profiles to the north and south of the study area (without vertical exaggeration).
The thickness of the Cauê Formation varies from 200 m, in the south, to 1,400 m in the northern portion of the Moeda Syncline. The Gandarela Formation, in contrast, shows more variation, with its greatest thickness being approximately 1,650 m and the smallest 20 m. The same pattern is observed in the Moeda Formation, which reaches a thickness of 1,300 m in the north of the syncline and approximately 40 m in its southern portion, corroborating Braga’s (2006)Braga S.C.M. 2006. Modelagem estrutural e geofísica da porção centro-norte do Sinclinal Moeda, Quadrilátero Ferrífero, MG. MS Dissertation, Universidade Federal de Ouro Preto, Ouro Preto, 113 p. hypothesis. The thicknesses found to agree with Maxwell (1972)Maxwell C.H. 1972. Geology and ore deposits of the Alegria district, Brazil. Washington, D.C.: USGS/DNPM, 72 p., Rosière and Chemale Jr. (2000)Rosière C.A., Chemale Jr. F. 2000. Itabiritos e minérios de ferro de alto teor do Quadrilátero Ferrífero: uma visão geral e discussão. Geonomos, 8(2):27-43. https://doi.org/10.18285/geonomos.v8i2.155
https://doi.org/https://doi.org/10.18285...
, Beato et al. (2006)Beato D.A.C., Monsores A.L.M., Bertachini A.C. 2006. Potencial aquífero nos metassedimentos do Quadrilátero Ferrífero - região da APA SUL RMBH - MG. In: Congresso Brasileiro de Águas Subterrâneas, 14., Curitiba. Proceedings… Curitiba, p. 1-20., and Rossi (2014)Rossi D.Q. 2014. Estratigrafia e arcabouço estrutural da região de Fábrica Nova, Quadrilátero Ferrífero, Minas Gerais. Dissertation, Escola de Minas da Universidade Federal de Ouro Preto, Ouro Preto..
As shown in Figure 5, in the Moeda Syncline, the aquifer units reach depths of more than 1,500 m, and in the studied region the deepest water level recorded by the instruments surveyed is at the elevation of 870 m. Due to the great thickness of the packages and the knowledge that porosity decreases with depth, it was adopted the division of each aquifer in half of its depth, being the upper package the one with greater porosity.
Hydrodynamic parameters
To obtain the parameters, only the aquifer units were analyzed due to data scarcity. This step resulted in the values presented in Table 4, with the hydraulic conductivity data obtained by the method of Bouwer and Rice (1976)Bouwer H., Rice R.C. 1976. A Slug test method for determining hydraulic conductivity of unconfined aquifers with completely or partially penetrating wells. Water Resources Research, 12(3):423-428. https://doi.org/10.1029/WR012i003p00423
https://doi.org/https://doi.org/10.1029/...
and the transmissivity and storage values obtained by the method of Cooper et al. (1967)Cooper Jr. H.H., Bredehoeft J.D., Papadopulos S.S. 1967. Response of a finite-diameter well to an instantaneous charge of water. Water Resources Research, 3(1):263-269. https://doi.org/10.1029/WR003i001p00263
https://doi.org/https://doi.org/10.1029/...
. In all, 15 pumping tests of wells located in the three identified aquifer units were analyzed, most of which were located in the North Sector of the area, except for three wells, one in each of the other sectors. Therefore, the obtained values are more representative of the northern region.
Overall, it can be observed that the hydraulic conductivity values obtained were similar for the three units, on the order of 10-7 to 10-8. For the Cauê Aquifer, the value is well below those presented by Mourão (2007)Mourão M.A.A. 2007. Caracterização hidrogeológica do Aquífero Cauê: subsídios para a gestão de recursos hídricos no Quadrilátero Ferrífero. Thesis, Universidade Federal de Minas Gerais, Belo Horizonte, 297 p. and Schlumberger Water Services (2017)Schlumberger Water Services. 2017. Estudo Hidrogeológico Coca-Cola FEMSA Unidade Itabirito. Rio de Janeiro: Schlumberger Water Services. but is consistent with those obtained by Mesquita (2017)Mesquita D.C., Dantas J.C.M., Paula R.S., Guerra K.J. 2017. Estudo dos parâmetros hidrodinâmicos obtidos em ensaios de campo em itabiritos brandos da porção sudoeste do Quadrilátero Ferrífero, MG. Geonomos, 25(2):12-19. https://doi.org/10.18285/geonomos.v25i2.1077
https://doi.org/https://doi.org/10.18285...
and Bertachini (2020)Bertachini M.N.A. 2020. Determinação da condutividade hidráulica do Aquífero Cauê na região oeste do Sinclinal Moeda, Nova Lima/MG. Monografia, Universidade de São Paulo, São Paulo.. The hydraulic conductivity of the Moeda Aquifer is similar to that presented by Mourão (2007)Mourão M.A.A. 2007. Caracterização hidrogeológica do Aquífero Cauê: subsídios para a gestão de recursos hídricos no Quadrilátero Ferrífero. Thesis, Universidade Federal de Minas Gerais, Belo Horizonte, 297 p., and the Gandarela Aquifer, besides being below the minimum value obtained by Mourão (2007)Mourão M.A.A. 2007. Caracterização hidrogeológica do Aquífero Cauê: subsídios para a gestão de recursos hídricos no Quadrilátero Ferrífero. Thesis, Universidade Federal de Minas Gerais, Belo Horizonte, 297 p., is also below the values obtained by Schlumberger Water Services (2017)Schlumberger Water Services. 2017. Estudo Hidrogeológico Coca-Cola FEMSA Unidade Itabirito. Rio de Janeiro: Schlumberger Water Services.. The variation of the hydraulic conductivity of the Cauê Aquifer may be linked to the heterogeneity and anisotropy of the system. These values tend to decrease in depth due to the decrease of voids and/or closure of fractures.
As for the transmissivity values, due to the wide variation in thickness of the aquifers, it would not be appropriate to compare the values obtained with those presented in the literature.
The highest storage was verified in the Cauê Aquifer, which is a free aquifer as well as the Moeda Aquifer and the Gandarela Aquifer. Similar results were obtained by Mesquita (2017)Mesquita D.C., Dantas J.C.M., Paula R.S., Guerra K.J. 2017. Estudo dos parâmetros hidrodinâmicos obtidos em ensaios de campo em itabiritos brandos da porção sudoeste do Quadrilátero Ferrífero, MG. Geonomos, 25(2):12-19. https://doi.org/10.18285/geonomos.v25i2.1077
https://doi.org/https://doi.org/10.18285...
and Schlumberger Water Services (2017)Schlumberger Water Services. 2017. Estudo Hidrogeológico Coca-Cola FEMSA Unidade Itabirito. Rio de Janeiro: Schlumberger Water Services. for both the Cauê Aquifer and the Gandarela Aquifer. Observing the minimum values obtained, it can be said that the Cauê and Gandarela aquifers present confined portions, a characteristic that may not have been detected in the Moeda Aquifer due to the low number of tests analyzed.
Water balance and renewable reserve
The map of the domains of the rainfall stations according to the Thiessen method (1911) shows the three stations used for the rainfall analysis (Fig. 6). It is observed that rainfall in the rainy season is higher at the northernmost stations, exceeding 400 mm in December at Caixa de Areia station, as shown in the graph of this station.

Location of the selected rainfall stations and separation of Thiessen polygons. The rainfall data are for monthly and annual averages between 1999 and 2019.
The table presented in Figure 6 shows the area represented by each rainfall station, the respective average annual rainfall, and the results obtained by the Thiessen method. The annual rainfall for the study area was approximately 1,490 mm considering the period between 1999 and 2019. This value is greatly influenced by the representativeness of the Rio do Peixe and Itabirito stations, which contribute approximately 90% of the precipitation volume in the area.
For the calculation of the climatological water balance of Thornthwaite-Mather (1955)Thornthwaite C.W., Mather J.R. 1955. The water balance. New Jersey: Drexel Institute of Technology, 104 p. Publications in Climatology., a total rainfall of 1,576 mm was considered at the Rio do Peixe station, the most representative areal station and the closest to the value obtained by the Thiessen method. The water holding capacity was considered as 100 mm. As an average for the studied period, the following were obtained for the whole area: 888 mm ETA (56%), 1,059 mm PET, 701 mm WS (44%), and 171 mm WD. WD occurs between the months of April and October and WS between November and March. These values are consistent with a humid subtropical climate since precipitation is higher than evapotranspiration.
For the recharge estimation, according to the described method, 17 suitable basins were selected, in diverse lithologies, as exemplified in Figure 7 and shown in Table 5, and their areas were calculated. It is observed that the selected basins comprise only one lithology.

Comparison of recharge rates obtained from literature and separation of hydrographs and calculated BFI.
From the consolidation of the information obtained from the Thiessen polygons and the separation of hydrographs, it was possible to obtain the recharge values and BFI presented in Table 5.
The recharge rate calculated for the Cauê Aquifer was very close to that obtained by Mourão (2007)Mourão M.A.A. 2007. Caracterização hidrogeológica do Aquífero Cauê: subsídios para a gestão de recursos hídricos no Quadrilátero Ferrífero. Thesis, Universidade Federal de Minas Gerais, Belo Horizonte, 297 p.. The low recharge of the Gandarela Aquifer is probably due to its low primary porosity and scarcity of fractures in the monitored basin. For the Moeda Aquifer, no suitable basins were located for recharge calculation, and the rate was not found in other bibliographies either.
As for the BFI, the highest rates obtained were for Cauê Aquifer and Nova Lima Aquitard. In the Cauê Aquifer, this is justified by its high permeability and hydraulic conductivity, which facilitate infiltration to the detriment of surface runoff. In the Nova Lima Aquitard, however, the high BFI is due to its heterogeneity. In certain areas, this unit can behave as a productive fissural aquifer and can be considered a semi-permeable barrier. The Gandarela Aquifer, in turn, showed low BFI due to its anisotropy. The low index of the Batatal Aquitard shows its low productivity, as well as the Piracicaba Aquitard.
The recharge rates calculated in this study were used as a basis for estimating the renewable reserve, whose results are shown in Figure 8. It was not possible to calculate recharge in the Moeda Aquifer and the Bação Complex Aquifer due to the absence of fluviometric stations whose basins are mostly located in these units. Thus, to calculate the renewable reserve for the Moeda Aquifer, the average between the recharge rate of the other aquifer units (Cauê and Gandarela) was used, and for the Bação Complex Aquitard, the recharge obtained by Freitas and Bacellar (2013)Freitas S.M.A.C., Bacellar L.A.P.B. 2013. Avaliação da Recarga de Aquíferos em Microbacias do Alto Rio das Velhas, Minas Gerais. Revista Brasileira de Recursos Hídricos, 18(2):31-39. https://doi.org/10.21168/rbrh.v18n2.p31-38
https://doi.org/https://doi.org/10.21168...
was used.

Figure 8 presents the calculated renewable reserve for the Cauê Aquifer and for the study area. The pumping volumes granted annually in the whole area were summed, and the result is represented by the red line. The abstracted volume was considered equal to the volume granted by Igam, since there is no reliable data available for each mine’s exact pumping rate.
From the graph, it is observed that in the years with the greatest drought, such as 2013/2014, the volume abstracted is close to the total renewable reserve in the area. This suggests that there is a considerable regional impact resulting from exploitation, even with the contribution of the entire aquifer system evaluated for the volume exploited, which can impact the water availability of the region. The water balance described below further illustrates this situation.
The average volume of the renewable reserve in the Cauê Aquifer is about 27 million m³/year, while in the whole area the renewable reserve is approximately 93 million m³/year. Thus, despite representing only 15% of the study area, the Cauê Aquifer contributes to about 30% of the recharge in the region.
To perform the water balance of the area, it was considered that the total WS consists of the sum of the renewable reserve, surface runoff, subsurface runoff, and volume withdrawn from the system (surface and underground abstractions). Considering the annual WS of 701 mm, obtained by the Thornthwaite-Mather method (1955)Thornthwaite C.W., Mather J.R. 1955. The water balance. New Jersey: Drexel Institute of Technology, 104 p. Publications in Climatology., in the 305 km² area, a WS volume of 214 million m³/year was calculated. The renewable reserve was previously estimated at 93 million m³/year, and the average volume pumped in the analyzed period was 41 million m³/year. Thus, disregarding the surface abstractions that may occur, it can be said that the volume of surface and subsurface runoff totals approximately 80 million m³/year, i.e., 37% of the hydric surplus.
From these data, the average BFI of the area can be estimated by adding the renewable reserve and the underground abstractions and dividing this value by the total WS. This calculation shows an average BFI of 63%. The average BFI for the area given by the method of hydrogram separation results in 58%, which is very close and reveals a significant contribution of groundwater to river flow.
Using the same logic specifically for the Cauê Aquifer, with the same WS of 701 mm and an area of 48 km² where this unit outcrops, the volume of the estimated WS is 33.6 million m³/year. Subtracting from this value the average renewable reserve of 27 million m³/year, the resulting surface runoff, added to surface abstractions and subsurface runoff, is approximately 6.6 million m3, or 20% of the WS. This proportion indicates that the rate of surface runoff in the Cauê Aquifer is much lower than in the other units, which is corroborated by the high BFI of this unit (69%). These values, however, were based on the Thornthwaite-Mather (1955)Thornthwaite C.W., Mather J.R. 1955. The water balance. New Jersey: Drexel Institute of Technology, 104 p. Publications in Climatology. method, which disregards water abstractions.
Taking pumping into account, 73% of the wells surveyed are in the Cauê Aquifer. As this unit has a higher hydraulic conductivity and storage than the others, it is expected to contribute to an even more significant flow. The volume pumped in the area annually was estimated at 41 million m³ on average, considering the granted pumping rates, which is about one and a half times the renewable reserve of the Cauê Aquifer. This means that while the aquifer is recharged with an average flow rate of 3,082 m³/h, about 4,680 m³/h is pumped. One can see from the graph that since the year 2004, the volume granted is greater than the renewable reserve of this aquifer unit.
The main uncertainties in these estimates are the pumping volumes and the recharge rate. The amount of water granted is the minimum pumping that occurs in the region, since there is no way to account for unregistered wells. Thus, the impact generated is probably greater than that presented. Also, the recharge rate can vary locally due to soil coverage, land use, and lithology variations, but it is more likely to be reduced in reality since these are main obstacles to the aquifer recharge. Another uncertainty is that no data from the Igam database was verified on the field, so there could be other abstractions and inputs to the superficial runoff, as well as inaccuracies in the database in general.
However, considering the estimated values, the pumped volume exceeds the renewable reserve by 14 million m3. This volume can be obtained from the following three sources:
-
From the permanent reserve: It is expected that pumping affects the permanent reserve, since for the lowering of the water level in mining, it is necessary to exploit part of this volume. However, this pumping is not returning to the natural system;
-
From surface runoff: By interfering with the level of the aquifer’s permanent reserve, the influence of groundwater on drainage decreases, tending to reduce its flow;
-
From the other units: The overexploitation of the Cauê Aquifer, the most permeable of the region, can generate flow reversal in the sectors of greater pumping, i.e., water can start flowing from the less permeable units toward the more permeable ones where this did not occur previously. This aspect will be better described in the following topic.
Flow analysis
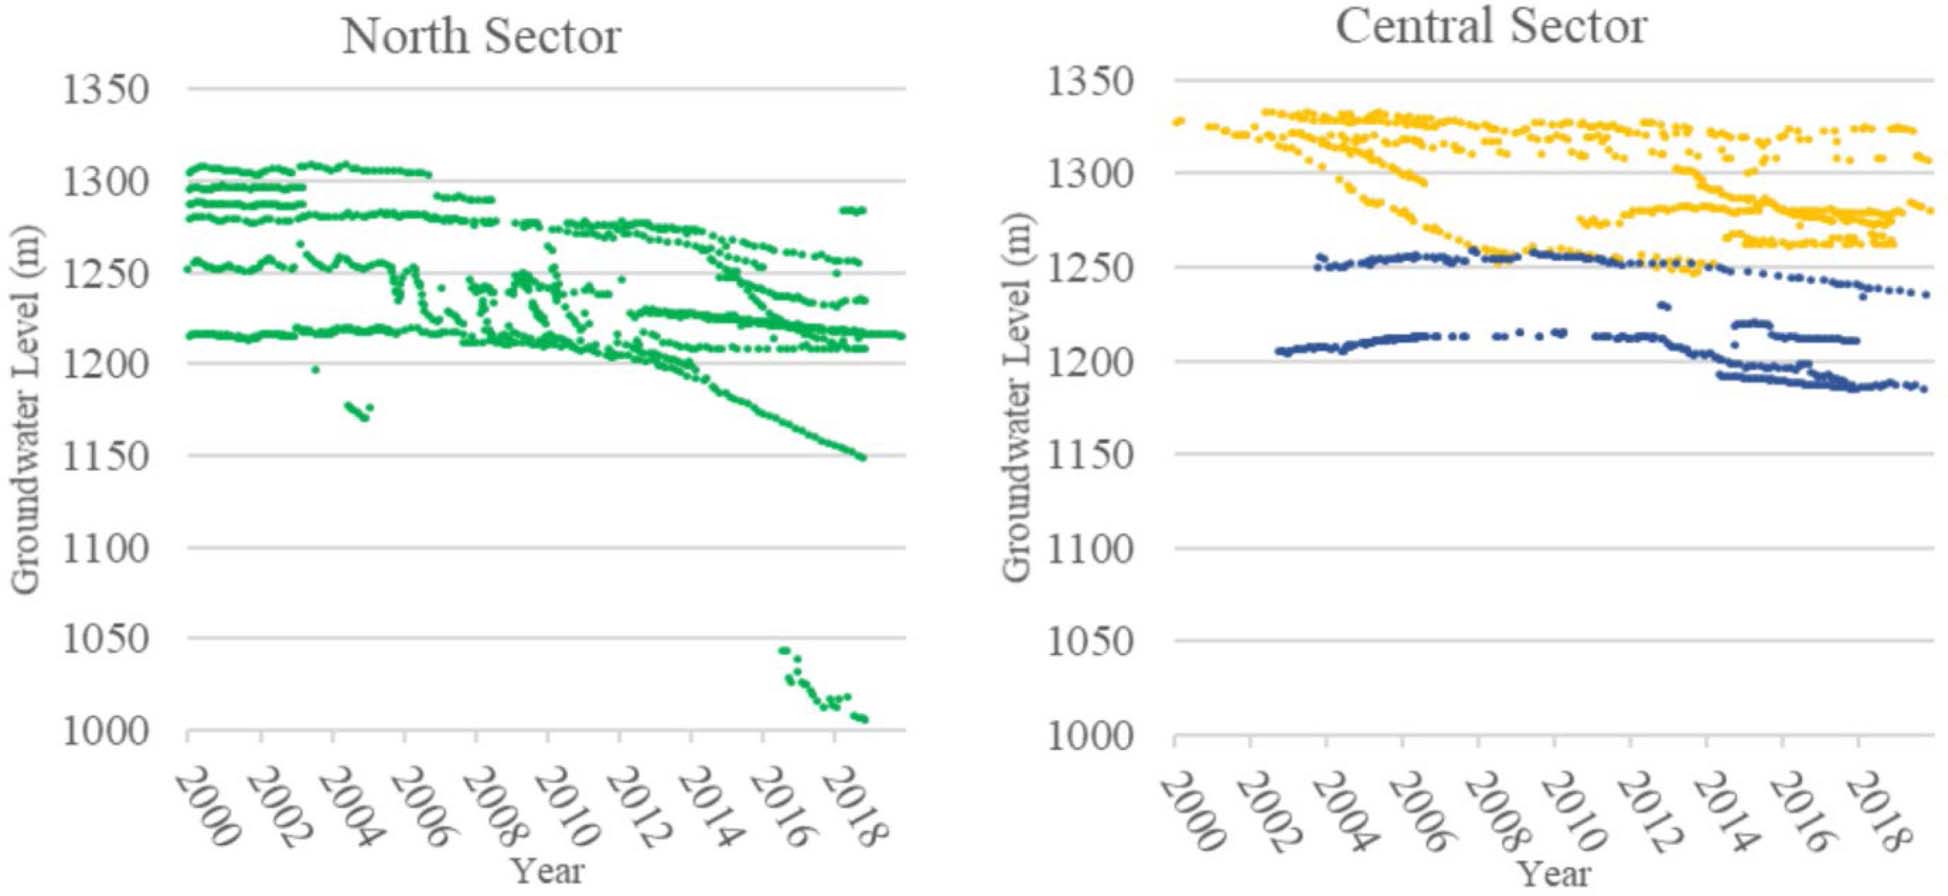
To analyze whether there is flow reversal or other anomalies, from the compilation of the water level monitoring series, the maps and graphs presented in Figures 9, 10, and 11 were generated. For the flow analysis, the area was subdivided into four sectors identified as North, Central 1, Central 2, and South, according to geological structures and the behavior of the underground flow. It is also noted that the sectors separate areas with different main directions of the lithological layers in relation to the north.


Three-dimensional view of the potentiometric surface in the main units of the studied area. Arrows indicate the location of the mining companies. Vertical exaggeration: 10×.

Graphs of the water level lowering between 2000 and 2019. The instruments in blue represent the Central 1 sector and the instruments in yellow represent the Central 2 sector.
In the southern sector, no enterprises that explore underground water were identified in Igam’s database; therefore in this region, the equipotential curves were generated from control points (drainage network and topography) and may not be representative of the actual local piezometry. For this reason, the map and graphs only show instruments located in the northern and central sectors.
From the potentiometric map and potentiometric surface generated (Figs. 9 and 10), it is observed that the lowest water levels are in the southern sector and along the eastern edge of the studied area, while the portions with the highest water levels are approximately aligned in a band that cuts through the central and northern sectors. This band follows the mapped area of the Cauê Aquifer, which indicates a greater influence of this unit on the water level in the northern and central sectors, where this unit presents greater thickness. Furthermore, this pattern suggests that the main underground flow direction is southward, toward the Itabirito River, local base level, with a hydraulic gradient of 8.75 m/km, and eastward, toward the Das Velhas River, regional base level, with an average hydraulic gradient of 80 m/km.
It is important to highlight that the map represents the regional flow, not local, mainly in the south sector. Considering that the instruments in the Central 2 sector show an average water level of about 1,300 m and the Itabirito River’s elevation is about 1,000 m in the extreme south, it can be noted that the flow has a predominant southern direction. This is corroborated by the potentiometric surface presented in Figure 10D, which shows the level reduction toward the south.
In the Central 2 sector, the function of the Cauê Aquifer as a water divide is also notable, but with a greater hydraulic gradient toward the east than toward the west. In this sector, there is an elongated cone of depression in the approximate north-south direction, with flow from north to south and from south to north, generating convergence to the center of the existing pit. In the north of Central 2 sector, the cone of depression becomes more pronounced, showing contributions from the Gandarela and Moeda Aquifers to the Cauê Aquifer.
In this sector, the lowering of the water level measured by the instruments over the studied period is significant, as shown in the graph (Fig. 11). Between 2000 and 2019, it can be noted that one of these instruments showed a lowering of about 80 m.
In the Central 1 sector, the presence of the water divide is not so pronounced. In this region, one notices an aggressive cone of depression, with flow reversal both in the E-W and N-S directions. It is observed, contrary to expectations, that the flow is from north to south, and to the north is the Do Peixe River, an important local base level. Convergent flow is also observed toward the central strip of the sector, despite the intense regional hydraulic gradient to the east, and the central strip being the one with the highest hydraulic conductivity (Cauê Aquifer). Also notable is the lowering of these instruments in Figure 11.
Finally, in the Northern sector, the Cauê Aquifer once again acts as a water divide. It is notable the contribution of the underground flow toward the Das Velhas River channel, being the hydraulic gradient much more intense to the east. This occurs because the Piracicaba Aquitard is more impermeable than the Batatal and Nova Lima Aquitards, which causes less impact in the center of the Moeda Syncline. In the center of the North sector, there is also a cone of depression with flow reversal, and the water level in this region reaches levels below 1,000 m. In this sector, in general, the flow converges to the Do Peixe River, which drains into the Das Velhas River.
In general, the regional flow tends southward and is more pronounced toward the Das Velhas River than toward the center of the Syncline. It is also observed that the Cauê Aquifer acts as a water divide, which is less evident in the Central 1 sector, where the greatest impact occurs. The Cauê Aquifer also has the deepest levels of the potentiometric surface in relation to the topography, which can be seen in Figure 10 and Table 3.
Regarding the historical series presented, it should be noted that only the instruments located in the Cauê Aquifer were represented in the graphs, and that the instruments surveyed are concentrated in and around mining pits. In general, the piezometers lowered on average 37 m in 20 years, with the Northern and Central 2 sectors suffering the greatest impact, with about 40 m of lowering on average, and the Central 1 sector with the least lowering, about 23 m.
In view of this analysis, it is important to note that, although most of the wells in the region are drilled in the Cauê Aquifer, the pumped volume also comes from adjacent units such as the Gandarela Aquifer, to a lesser extent from the Batatal Aquifer and from the Moeda Aquifer.
CONCLUSIONS
This study generated information that makes up the conceptual hydrogeological flow model of the eastern limb of the Moeda Syncline, which includes the Cauê Aquifer, the Gandarela Aquifer, and the Moeda Aquifer.
The importance of groundwater in maintaining drainage flows can be demonstrated by the calculated BFI of 63%. This significant base flow contribution to surface drainage is of utmost importance for the supply of the MRBH throughout the year.
As for the exploitation that has been occurring in the aquifer, it exceeds 50% of the renewable reserve of the Cauê Aquifer and is close to the renewable reserve of the area. This means that the exploitation also affects the permanent reserve, the surface runoff, and the units adjacent to the Cauê Aquifer. Considering the uncertainties presented, the impact generated is probably greater than that estimated.
In the North and Central sectors, cones of depression related to the mines surveyed were identified. The greatest impact was seen in the North and Central 2 sectors, with an average lowering of 40 m. The Central 1 sector, despite having suffered less drawdown, shows signs of significant impact and flow reversal. Despite the absence of data in the South sector, it can be said that this sector suffered less impact, since no large enterprises or concessions are located there.
Despite the absence of a regional hydrological monitoring network, it can be concluded that the Cauê Aquifer presents different levels of impact in each of the identified sectors. In general, there seems to be an unbalance between exploitation and recharge, which could impact the superficial runoff.
Since superficial water is not the focus of this study, another study should be conducted regarding superficial and groundwater, quantifying the regional impact in the Upper Das Velhas River Watershed. In addition, we highlight the need for a quantitative monitoring network for the region in order to generate more robust models in the future and improve water management in the Moeda Syncline.
ACKNOWLEDGMENTS
To UFMG and the Geosciences Institute for providing the development of the study; to Igam and the State Secretariat of Environment and Sustainable Development for the partnership and for providing the database; to Seequent ltd. for providing access to the software Leapfrog Geo.
ARTICLE INFORMATION
-
Manuscript ID: 20220005.How to cite this article: Magalhães C.C.C., Melo M.C., Guiger N., Paula R.S. The Cauê Aquifer on the eastern limb of Moeda Syncline: characterization, impacts, and flow in an area west of Iron Quadrangle (Quadrilátero Ferrífero) – MG, Brazil. Brazilian Journal of Geology, 52(4):e20220005, 2022. https://doi.org/10.1590/2317-4889202220220005
REFERENCES
- Agência Nacional de Mineração (ANM). 2020. Anuário mineral brasileiro: principais substâncias metálicas (Ano-Base 2019). Brasília: ANM, 34 p.
- Alkmim F.F., Marshak S. 1998. Transamazonian Orogeny in the Southern São Francisco Craton Region, Minas Gerais, Brazil: evidence for Paleoproterozoic collision and collapse in the Quadrilátero Ferrífero. Precambrian Research, 90(1-2):29-58. https://doi.org/10.1016/S0301-9268(98)00032-1
» https://doi.org/https://doi.org/10.1016/S0301-9268(98)00032-1 - Álvares C.A., Stape J.L., Sentelhas P.C., Gonçalves J.L. de M., Sparovek G. 2014. Köppen’s climate classification map for Brazil. Meteorologische Zeitschrift, 22(6):711-728. https://doi.org/10.1127/0941-2948/2013/0507
» https://doi.org/https://doi.org/10.1127/0941-2948/2013/0507 - Anderson M.P., Woessner W.W. 1992. Applied groundwater modeling: simulation of flow and advective transport. San Diego: Academic Press, 381 p.
- Barnes B.S. 1939. The structure of discharge recession curves. Transactions - American Geophysical Union, 20(4):721-725. https://doi.org/10.1029/TR020i004p00721
» https://doi.org/https://doi.org/10.1029/TR020i004p00721 - Beato D.A.C., Monsores A.L.M., Bertachinni A.C. 2005. Hidrogeologia. In: CPRM/SEMAD/CEMIG. Projeto Apa Sul RMBH - estudos do meio físico: área de proteção ambiental da região metropolitana de Belo Horizonte. Belo Horizonte: CPRM/SEMAD, 116 p.
- Beato D.A.C., Monsores A.L.M., Bertachini A.C. 2006. Potencial aquífero nos metassedimentos do Quadrilátero Ferrífero - região da APA SUL RMBH - MG. In: Congresso Brasileiro de Águas Subterrâneas, 14., Curitiba. Proceedings… Curitiba, p. 1-20.
- Bentley Systems, Inc. 2021. Leapfrog Geo 2021.1
- Bertachini A.C. 1994. Hidrogeologia e desaguamento da mina de Águas Claras. In: Congresso Brasileiro de Águas Subterrâneas – ABAS, 8., Recife. Proceedings… Recife, p. 274-283.
- Bertachini M.N.A. 2020. Determinação da condutividade hidráulica do Aquífero Cauê na região oeste do Sinclinal Moeda, Nova Lima/MG. Monografia, Universidade de São Paulo, São Paulo.
- Bertachini M.N.A., Bertachini A.C., Pereira B., Grandchamp C.A., Nunes F., Pereira Filho M. 2012. Estudos sobre os efeitos da Recarga Artificial (RA) sobre o Aquífero Cauê, no Quadrilátero Ferrífero-MG. In: Congresso Brasileiro de Águas Subterrâneas, 17., Bonito. Proceedings… Bonito.
- Bouwer H., Rice R.C. 1976. A Slug test method for determining hydraulic conductivity of unconfined aquifers with completely or partially penetrating wells. Water Resources Research, 12(3):423-428. https://doi.org/10.1029/WR012i003p00423
» https://doi.org/https://doi.org/10.1029/WR012i003p00423 - Braga S.C.M. 2006. Modelagem estrutural e geofísica da porção centro-norte do Sinclinal Moeda, Quadrilátero Ferrífero, MG. MS Dissertation, Universidade Federal de Ouro Preto, Ouro Preto, 113 p.
- CBH Rio das Velhas. 2015. Plano Diretor de Recursos Hídricos da Bacia Hidrográfica do Rio das Velhas: resumo executivo. Belo Horizonte. Available at: https://cdn.agenciapeixevivo.org.br/media/2020/06/RESUMO-EXECUTIVO-PDRH-VELHAS-2015.pdf Accessed on: Sept. 16, 2021.
» https://cdn.agenciapeixevivo.org.br/media/2020/06/RESUMO-EXECUTIVO-PDRH-VELHAS-2015.pdf - CBH Rio das Velhas. 2019. Comitê da Bacia Hidrográfica do Rio das Velhas. Revista Rio das Velhas, (9).
- Chemale Jr. F., Rosière C.A., Endo I. 1994. The tectonic evolution of the Quadrilátero Ferrífero, Minas Gerais, Brazil. Precambrian Research, 65(1-4):25-54. https://doi.org/10.1016/0301-9268(94)90098-1
» https://doi.org/https://doi.org/10.1016/0301-9268(94)90098-1 - Cooper Jr. H.H., Bredehoeft J.D., Papadopulos S.S. 1967. Response of a finite-diameter well to an instantaneous charge of water. Water Resources Research, 3(1):263-269. https://doi.org/10.1029/WR003i001p00263
» https://doi.org/https://doi.org/10.1029/WR003i001p00263 - Costa W.D. 1998. Avaliação de reservas, potencialidade e disponibilidade de aquífero. In: Congresso Brasileiro de Água Subterrânea, 10., São Paulo. Proceedings.. São Paulo.
- Cunha A.P.M.A., Zeri M., Leal K.D., Costa L., Cuartas L.A., Marengo J.A., Tomasella J., Vieira R.M., Barbosa A.A., Cunningham C., Garcia J.V.C., Broedel E., Alvalá R., Ribeiro-Neto G. 2019. Extreme drought events over Brazil from 2011 to 2019. Atmosphere, 10(11):642. https://doi.org/10.3390/atmos10110642
» https://doi.org/https://doi.org/10.3390/atmos10110642 - Dantas J.C.M., Mesquita D.C., Paula R.S., Guerra K.J. 2017. Correlação entre dados de perfilagem geofísica e potencial de bombeamento de poços em litotipos da Formação Cauê no sudoeste do Quadrilátero Ferrífero, MG. Águas Subterrâneas, 31(4):373-383. https://doi.org/10.14295/ras.v31i4.28910
» https://doi.org/https://doi.org/10.14295/ras.v31i4.28910 - Feitosa F.A.C., Manoel Filho J., Feitosa E.C., Demetrio J.G.A. 2008. Hidrogeologia: conceitos e aplicações. Rio de Janeiro: CPRM; Recife: LABHID, 812 p.
- Ferreira Q.C.G., Bacellar L.A.P. 2010. Avaliação preliminar das condições hidrogeológicas na área do município de Ouro Preto, MG. Geonomos, 18(1):13-21. https://doi.org/10.18285/geonomos.v18i1.63
» https://doi.org/https://doi.org/10.18285/geonomos.v18i1.63 - Freitas S.M.A.C., Bacellar L.A.P.B. 2013. Avaliação da Recarga de Aquíferos em Microbacias do Alto Rio das Velhas, Minas Gerais. Revista Brasileira de Recursos Hídricos, 18(2):31-39. https://doi.org/10.21168/rbrh.v18n2.p31-38
» https://doi.org/https://doi.org/10.21168/rbrh.v18n2.p31-38 - Guerra K.J. 2010. Aplicação de método geofísico em estudo hidrogeológico no município de Nova Lima – MG: caracterização de aquíferos em área urbana. MS Dissertation, Instituto de Geociências, Universidade Federal de Minas Gerais, Belo Horizonte, 116 p.
- Gustard A., Bullock A., Dixon J.M. 1992. Low flow estimation in the United Kingdom. Wallingford: Institute of Hydrology, 88 p.
- Instituto Brasileiro de Geografia e Estatística (IBGE). 2020. Regiões Metropolitanas, Aglomerações Urbanas e Regiões Integradas de Desenvolvimento. IBGE. Available at: https://www.ibge.gov.br/geociencias/organizacao-do-territorio/estrutura-territorial/18354-regioes-metropolitanas-aglomeracoes-urbanas-e-regioes-integradas-de-desenvolvimento.html Accessed on: May 3, 2021.
» https://www.ibge.gov.br/geociencias/organizacao-do-territorio/estrutura-territorial/18354-regioes-metropolitanas-aglomeracoes-urbanas-e-regioes-integradas-de-desenvolvimento.html - Instituto Nacional de Meteorologia (INMET). 2020. Banco de dados meteorológico para ensino e pesquisa - BDMEP. Brasília. Available at: https://bdmep.inmet.gov.br/ Accessed on Feb. 10, 2013.
» https://bdmep.inmet.gov.br/ - Köppen W., Geiger R. 1928. Klimate der Erde. Gotha: Verlagcondicionadas, Justus Perthes.
- Lobato L.M., Baltazar O.F., Reis L.B., Achtschin A.B., Baars F.J., Timbó M.A., Berni G.V., Mendonça B.R.V., Ferreira D.V. 2005. Projeto Geologia do Quadrilátero Ferrífero – Integração e Correção Cartográfica em SIG. Folha Ouro Preto. Escala 1:50.000.Belo Horizonte: Companhia de Desenvolvimento Econômico de Minas Gerais.
- Maxwell C.H. 1972. Geology and ore deposits of the Alegria district, Brazil. Washington, D.C.: USGS/DNPM, 72 p.
- Mesquita D.C., Dantas J.C.M., Paula R.S., Guerra K.J. 2017. Estudo dos parâmetros hidrodinâmicos obtidos em ensaios de campo em itabiritos brandos da porção sudoeste do Quadrilátero Ferrífero, MG. Geonomos, 25(2):12-19. https://doi.org/10.18285/geonomos.v25i2.1077
» https://doi.org/https://doi.org/10.18285/geonomos.v25i2.1077 - Miller J.A. 1999. Groundwater Atlas of the United States: introduction and national summary. United States Geological Survey Publication HA 730-A, 15 p.
- Mourão M.A.A. 2007. Caracterização hidrogeológica do Aquífero Cauê: subsídios para a gestão de recursos hídricos no Quadrilátero Ferrífero. Thesis, Universidade Federal de Minas Gerais, Belo Horizonte, 297 p.
- Paula R.S., Mesquita D.C., Dantas J.C.M., Guerra K.J. 2018. Caracterização hidroquímica e isotópica das águas, na porção sudoeste do Quadrilátero Ferrífero no município de Congonhas-MG, e sua correlação com a localização em cota das unidades aquíferas deste sistema. Águas Subterrâneas, 32(1):140-153. https://doi.org/10.14295/ras.v32i1.28970
» https://doi.org/https://doi.org/10.14295/ras.v32i1.28970 - Pimenta F., Lopes-Silva L., Pirotte N., Rosière C.A. 2009. Stratigraphic analysis of a carbonate sequence related to the BIFs of the Iron Quadrangle, southeastern Brazil. In: Biennial Meeting of the Society of Geology Applied to Mineral Deposits, 10., Townsville. SGA.
- Roeser H.M.P., Roeser P.A. 2010. O Quadrilátero Ferrífero – MG, Brasil: aspectos sobre sua história, seus recursos minerais e problemas ambientais relacionados. Geonomos, 18(1):33-37. https://doi.org/10.18285/geonomos.v18i1.67
» https://doi.org/https://doi.org/10.18285/geonomos.v18i1.67 - Rolim G.S., Sentelhas P.C., Barbieri V. 1998. Planilhas no ambiente EXCEL para os cálculos de balanços hídricos: normal, seqüencial, de cultura e de produtividade real e potencial. Revista Brasileira de Agrometeorologia, 6(1):133-137.
- Rosière C.A., Chemale Jr. F. 2000. Itabiritos e minérios de ferro de alto teor do Quadrilátero Ferrífero: uma visão geral e discussão. Geonomos, 8(2):27-43. https://doi.org/10.18285/geonomos.v8i2.155
» https://doi.org/https://doi.org/10.18285/geonomos.v8i2.155 - Rossi D.Q. 2014. Estratigrafia e arcabouço estrutural da região de Fábrica Nova, Quadrilátero Ferrífero, Minas Gerais. Dissertation, Escola de Minas da Universidade Federal de Ouro Preto, Ouro Preto.
- Schlumberger Water Services. 2017. Estudo Hidrogeológico Coca-Cola FEMSA Unidade Itabirito. Rio de Janeiro: Schlumberger Water Services.
- Serviço Geológico do Brasil (CPRM). 2003. Mapa geológico do estado de Minas Gerais. Escala 1:1.000.000. Belo Horizonte: CPRM.
- Silva S.L., Monteiro E.A., Baltazar O.F. 2005. Geologia. In: CPRM/SEMAD/CEMIG. Projeto APA Sul RMBH - estudos do meio físico: área de proteção ambiental da região metropolitana de Belo Horizonte. Belo Horizonte: CPRM/SEMAD, 73 p.
- Thiessen A.H. 1911. Precipitation averages for large areas. Monthly Weather Review, 39(7):1082-1084. https://doi.org/10.1175/1520-0493(1911)39%3C1082b:PAFLA%3E2.0.CO;2
» https://doi.org/https://doi.org/10.1175/1520-0493(1911)39%3C1082b:PAFLA%3E2.0.CO;2 - Thornthwaite C.W., Mather J.R. 1955. The water balance. New Jersey: Drexel Institute of Technology, 104 p. Publications in Climatology.
- Waterloo Hydrogeologic. 2016. AquiferTest Pro v.2016.1: Pumping & Slug Test Analisys, Interpretation & Visualization Software. Waterloo: Waterloo Hydrogeologic.
Publication Dates
-
Publication in this collection
04 Nov 2022 -
Date of issue
2022
History
-
Received
08 Jan 2022 -
Accepted
15 July 2022


 Source: based on
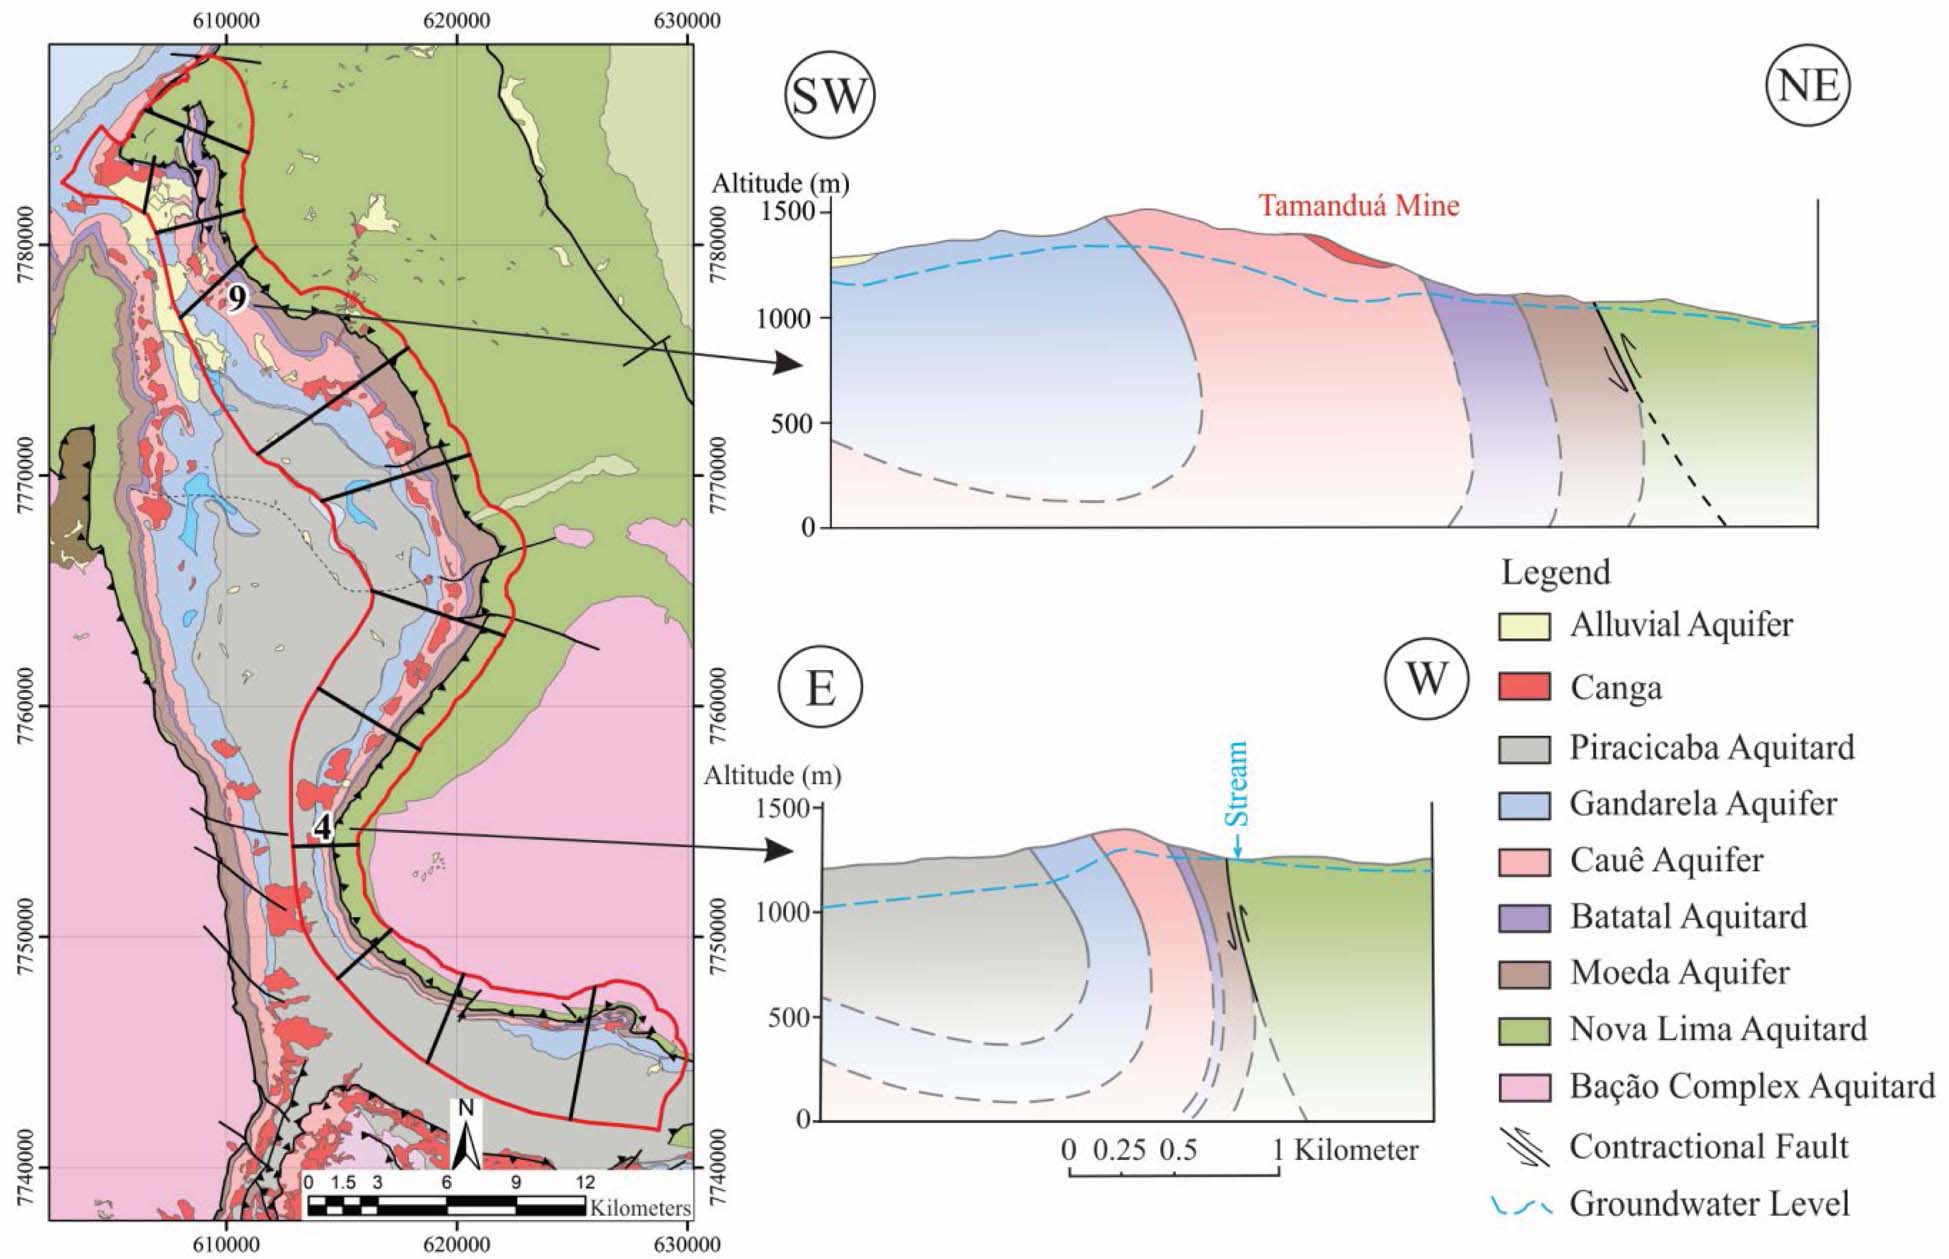


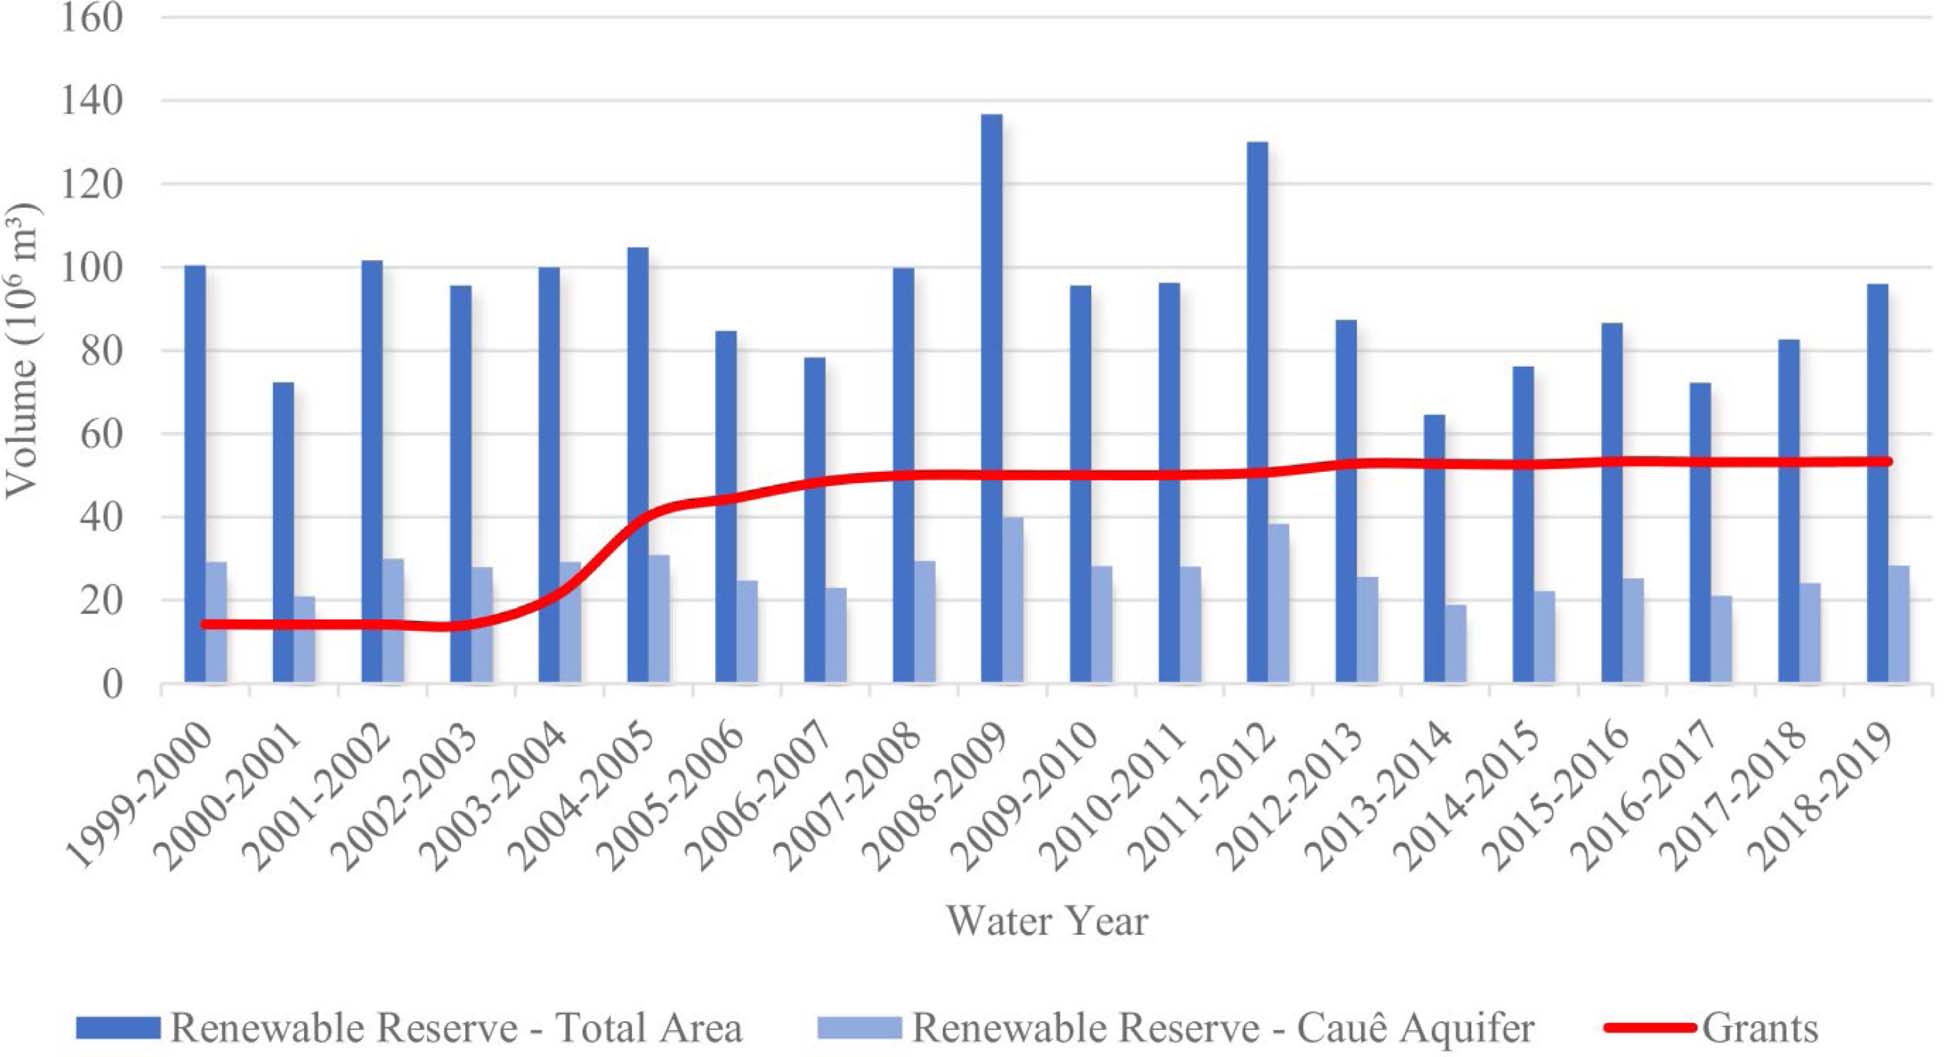
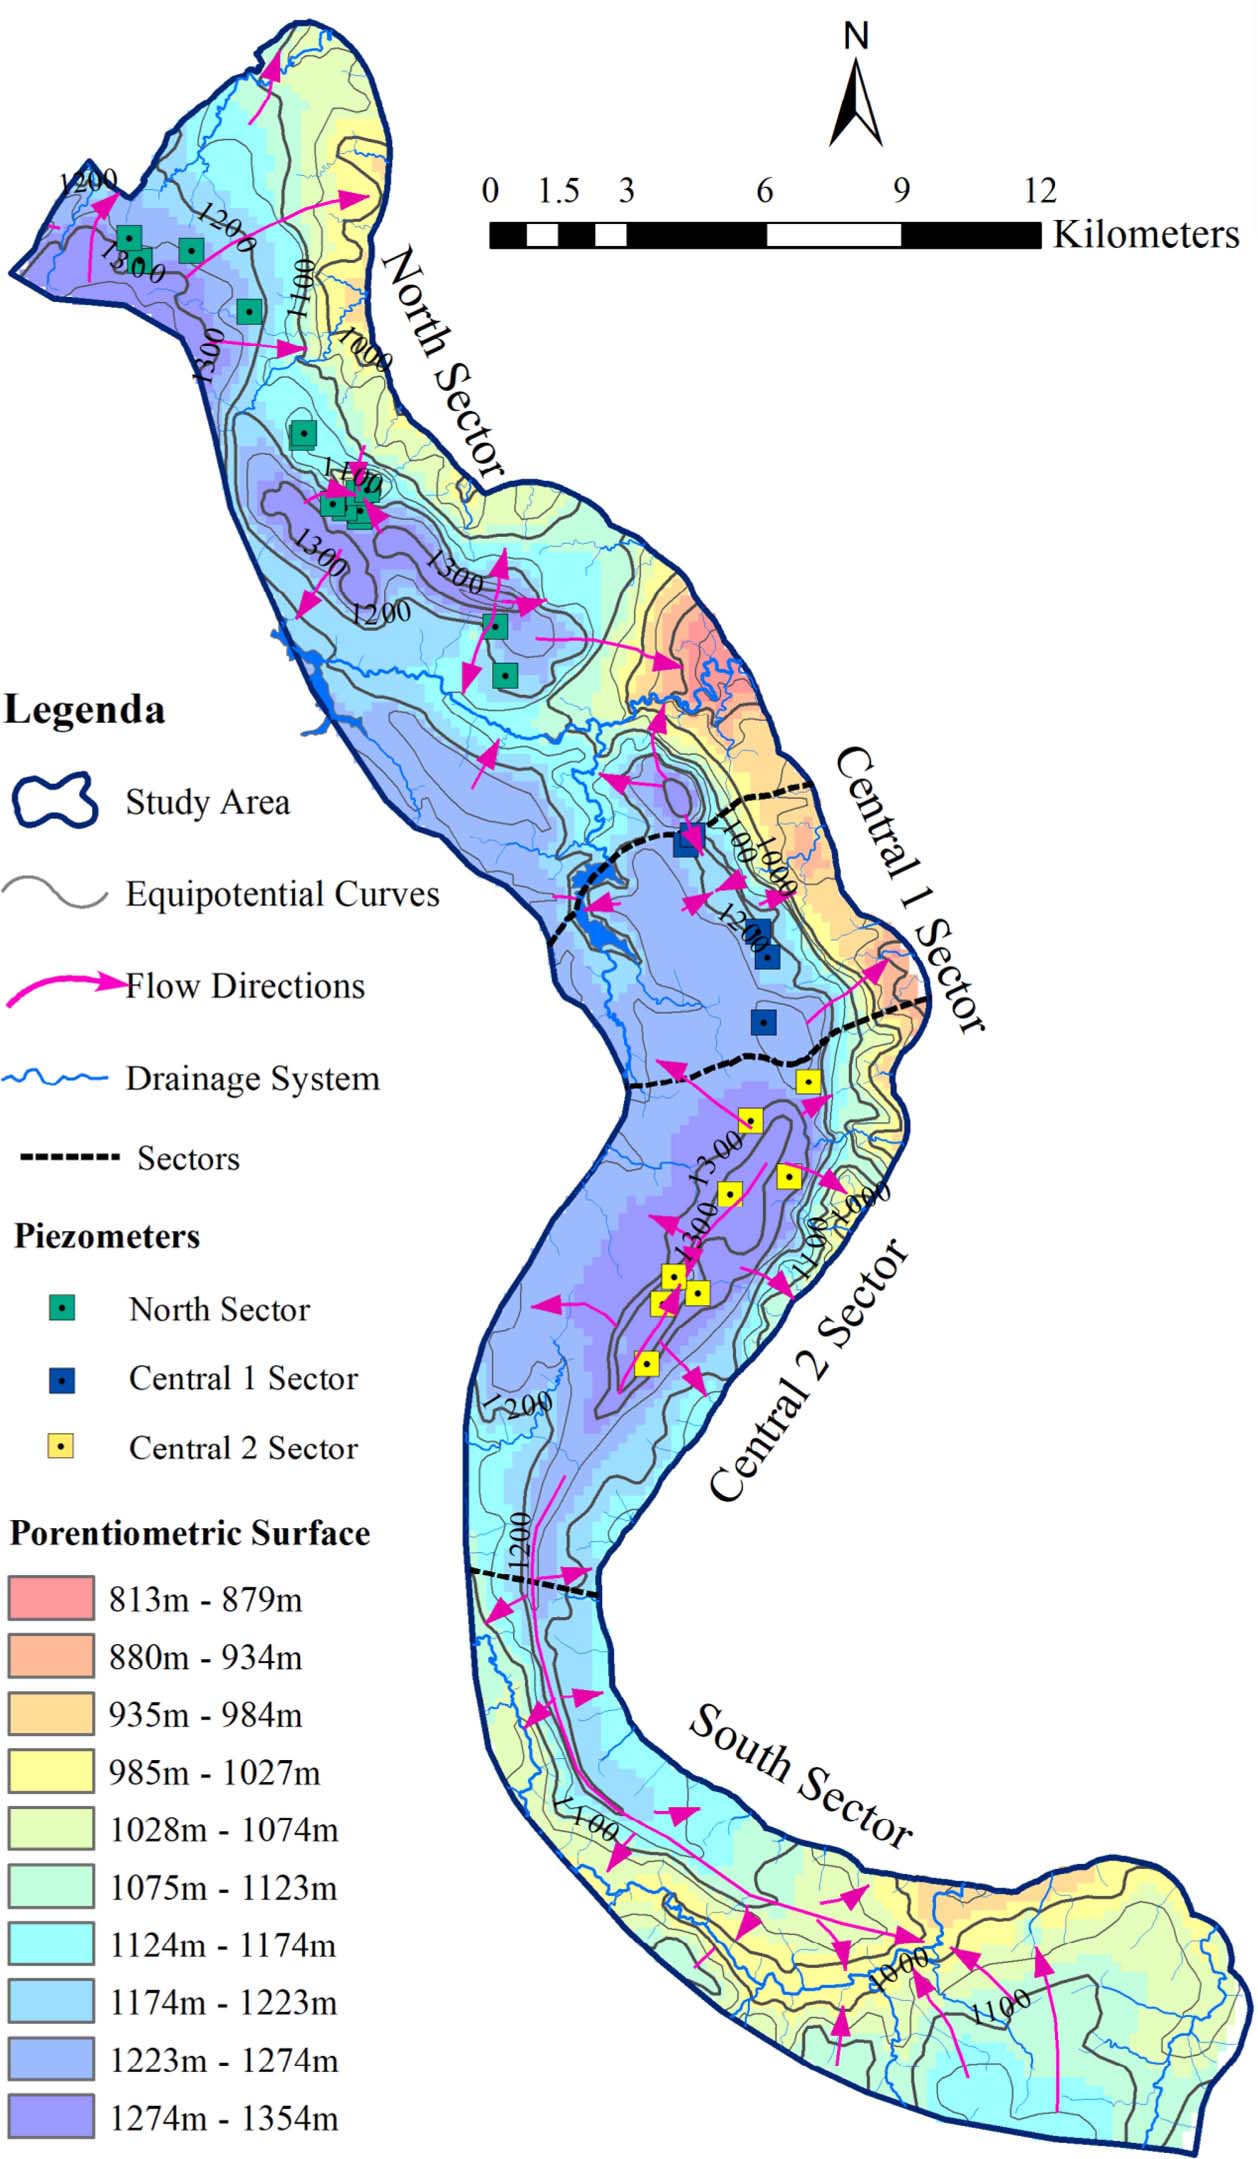
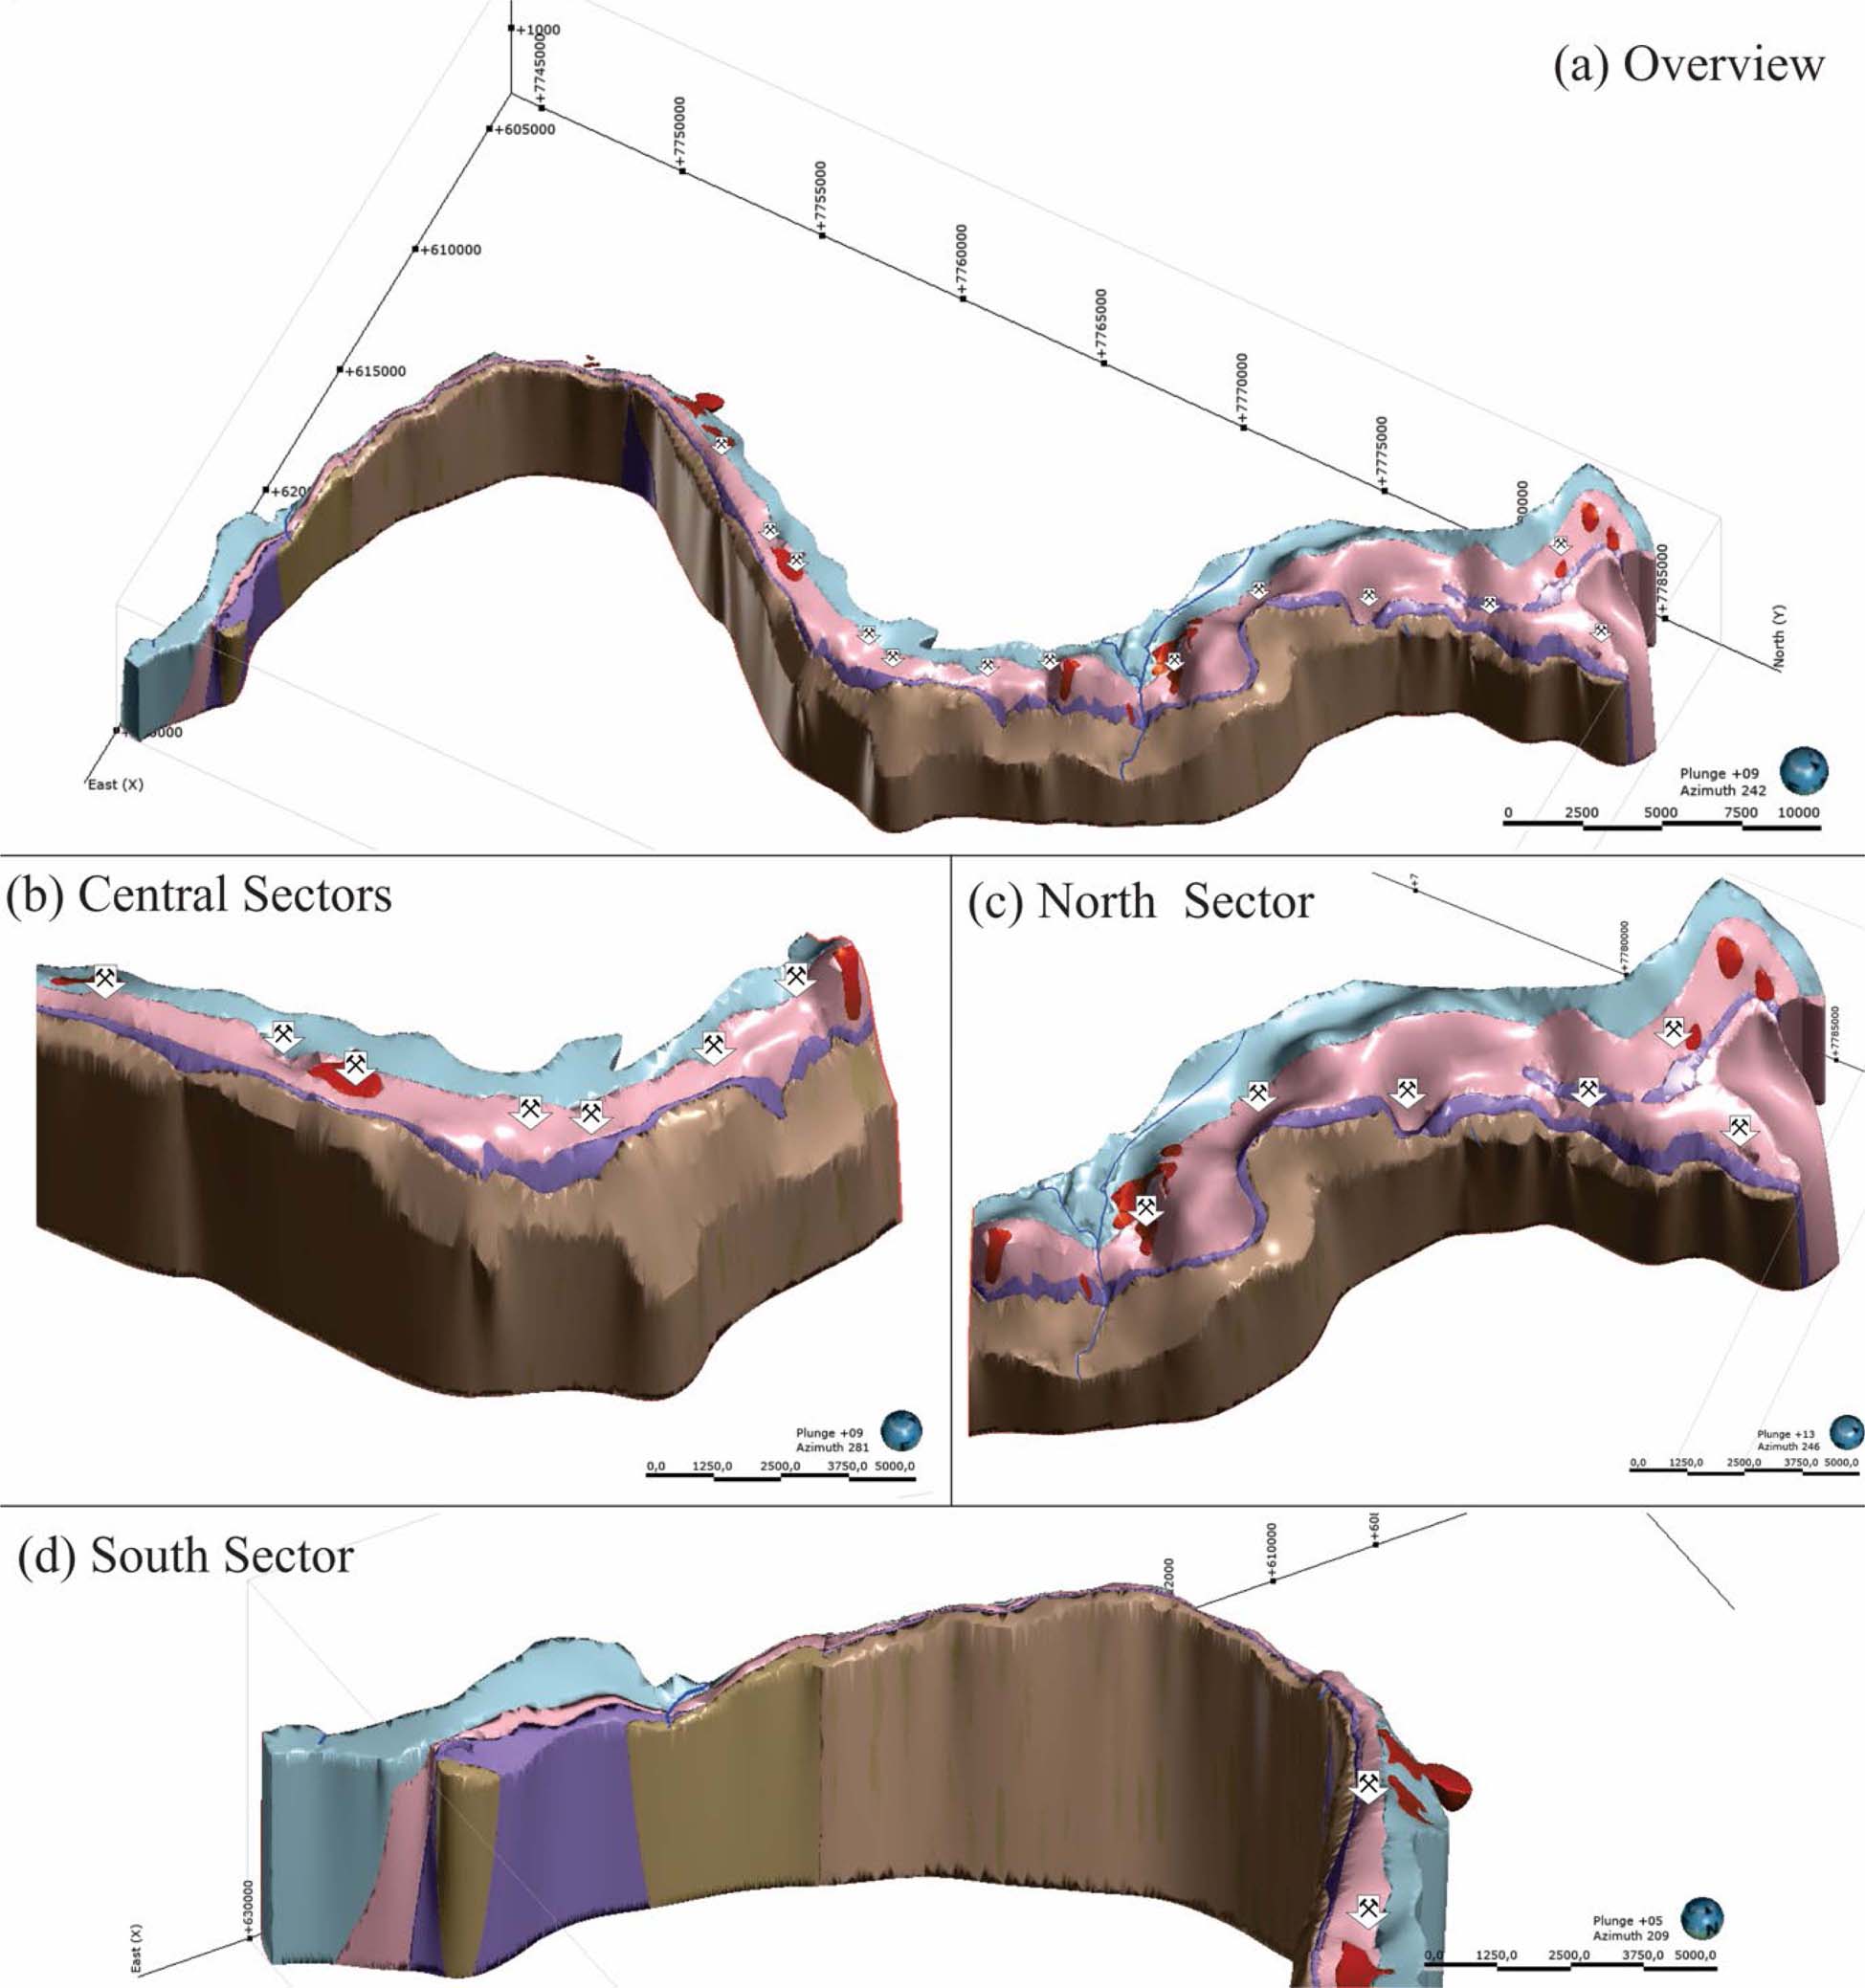 Source: generated using Leapfrog Geo, a Bentley Software (